

Imagine you have a jigsaw puzzle with a thousand pieces and want to understand the overall picture. Now, if you randomly select just a few pieces from the puzzle, let’s say only ten or twenty, you would have a limited representation of the complete picture.
It would be challenging to accurately determine the entire puzzle’s colors, patterns, and details based on such a small sample of pieces.
Just as a larger number of puzzle pieces gives us a clearer and more accurate understanding of the complete picture, a larger sample size in A/B testing provides us with more comprehensive insights into user behavior and performance.
In today’s article, we’re going to discuss sample size in A/B testing, why it is important, what factors you should consider when determining a sample size for your test, and how you can calculate the minimum required sample size in A/B testing.
What Is A Sample Size In A/B Testing
In A/B testing, sample size refers to the number of participants or observations we include in our experiment. It’s like the number of puzzle pieces we choose to work with.
A larger sample size allows us to capture a broader range of user preferences, behaviors, and responses to different variations. It helps reduce the impact of random fluctuations and provides more reliable statistically significant results.
Sample Size is important in A/B Testing for obtaining statistically significant and reliable test results, allowing you to draw meaningful conclusions and make informed decisions based on the test outcomes.
Importance of Sample Size In A/B Testing
-
Statistical Significance
Statistical significance indicates that the observed differences between your variations are not due to random chance.
An appropriate sample size increases the likelihood of detecting meaningful differences and obtaining reliable conclusions.
-
Accurate Decision Making
A well-chosen sample size enables accurate decision-making. It reduces the risk of drawing false conclusions or making incorrect judgments based on limited data.
With a sufficient sample size, you can have greater confidence in the outcomes of your A/B tests, allowing you to make informed decisions and take appropriate actions.
-
Sensitivity to Detect Smaller Effects
The sample size determines the sensitivity of your A/B test to detect meaningful effects. With a smaller sample size, it becomes more challenging to identify subtle but significant differences between variations.
-
Reduction of Sampling Error
A larger sample size helps minimize the impact of sampling error, the natural variation that occurs when you measure a subset of a larger population.
With a small sample size, random fluctuations may influence the results, leading to less reliable findings.
-
Cost Efficiency
Although acquiring a larger sample size may involve additional resources, it can lead to cost savings in the long run.
A well-powered A/B test with an adequate sample size provides more reliable and conclusive results, reducing the need for additional testing iterations and saving valuable time and resources.
Factors to Consider for Determining A/B Testing Sample Size
-
Statistical Significance
Statistical significance is an important factor to consider when determining the sample size. It represents the level of confidence you want to have in the results.
In other words, it helps you determine how confident you want to be that any observed differences between variations are not due to random chance.
-
Population Size
The size of your target population is another factor to consider. If your target population is large, you can work with a smaller sample size while still obtaining representative results.
Conversely, if your target population is small, you may need a larger sample size to ensure your findings are generalizable and applicable beyond the sample.
-
Confidence level
The confidence level refers to the degree of certainty you want in the results. It is typically expressed as a percentage of 95% or 99%. The higher the confidence level, the more certain you can be about the accuracy and reliability of the results.
-
Confidence Interval
Confidence interval represents the range of values in which you can reasonably expect the true effect or difference between variations to lie. It’s like the boundaries within which your findings are deemed trustworthy.
As the sample size increases, the confidence interval tends to narrower, and as the sample size decreases, the confidence interval becomes wider. A narrower confidence interval indicates higher precision, while a wider interval allows for more variability.
-
Expected response rate
The expected response rate, success rate, or measurable conversion rate difference represents the anticipated proportion of users who will respond to the tested variations.
Considering the expected response rate, you can gauge the sample size required to capture enough responses to draw reliable conclusions.
How to Calculate Sample Size in A/B Testing
Calculating the sample size in A/B testing is necessary to ensure reliable and meaningful results. When you are able to determine the appropriate number of participants or observations needed in each variation, you can optimize the statistical power of your experiment.
Let’s explore the methods and tools available for calculating the sample size in A/B testing.
-
Using Power Analysis
Power analysis in A/B testing is a statistical technique that helps determine the appropriate sample size needed to detect a meaningful effect or difference between variations.
It allows us to assess the statistical power of our experiment, which is the probability of correctly rejecting the null hypothesis when the alternative hypothesis is true.
Null hypothesis (H0): The default assumption is that no significant difference or effect exists between the tested variations. It assumes that any observed differences in performance or behavior are due to random chance or sampling variability.
Alternative hypothesis (H1): It contradicts the null hypothesis and proposes that there is indeed a significant difference or effect between the variations.
It suggests that the observed differences in performance or behavior are not due to random chance alone but instead, reflect a true difference caused by the tested variations.
To understand power analysis, let’s break it down into its components. Three key elements are involved: effect size, significance level (alpha), and power (1 – beta).
- Effect Size: The effect size represents the magnitude of the difference or effect you want to detect in your A/B test. It quantifies the practical or meaningful impact of the variation you’re testing.
- Significance Level (α): The significance level, denoted as α, determines the threshold for accepting or rejecting the null hypothesis. It represents the maximum probability of making a Type I error, which is falsely rejecting the null hypothesis when it is true. The commonly used significance level is 0.05 or 5%.
- Power (1 – Beta): Power, denoted as 1 – β, is the probability of correctly rejecting the null hypothesis when the alternative hypothesis is true. It represents the sensitivity of the test to detect a true effect. A higher power indicates a greater ability to detect meaningful differences.
The general formula for calculating sample size in A/B testing is as follows:
Sample Size = (Z^2 * σ^2) / (d^2)
Let’s break down the components of this formula:
- Z represents the desired level of confidence or significance level (α), typically set at 95% (Z = 1.96) or 90% (Z = 1.645).
- σ (sigma) represents the standard deviation or variability of the outcome variable measured in the A/B test. It reflects the spread or dispersion of data within each variation.
- d (delta) represents the desired effect size or the minimum difference between variations you want to detect as statistically significant. It indicates the practical significance of the difference you aim to observe.
By plugging in the values of Z, σ, and d into the sample size formula, you can determine the minimum number of participants or observations needed in each variation to achieve the desired level of statistical power.
-
Online Sample Size Calculator
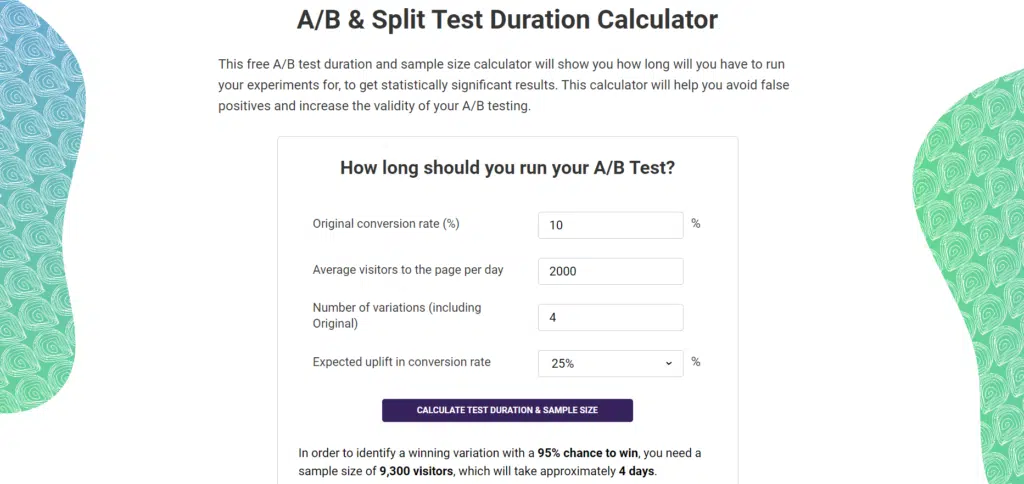
Online sample size calculators provide a convenient way to estimate the required sample size for an A/B test.
These calculators typically require inputs such as the desired confidence level, expected effect size, significance level, and other relevant parameters.
The calculator then estimates the minimum sample size needed to achieve the desired statistical power. An online sample size calculator can save time and effort, especially if you are unfamiliar with statistical calculations.
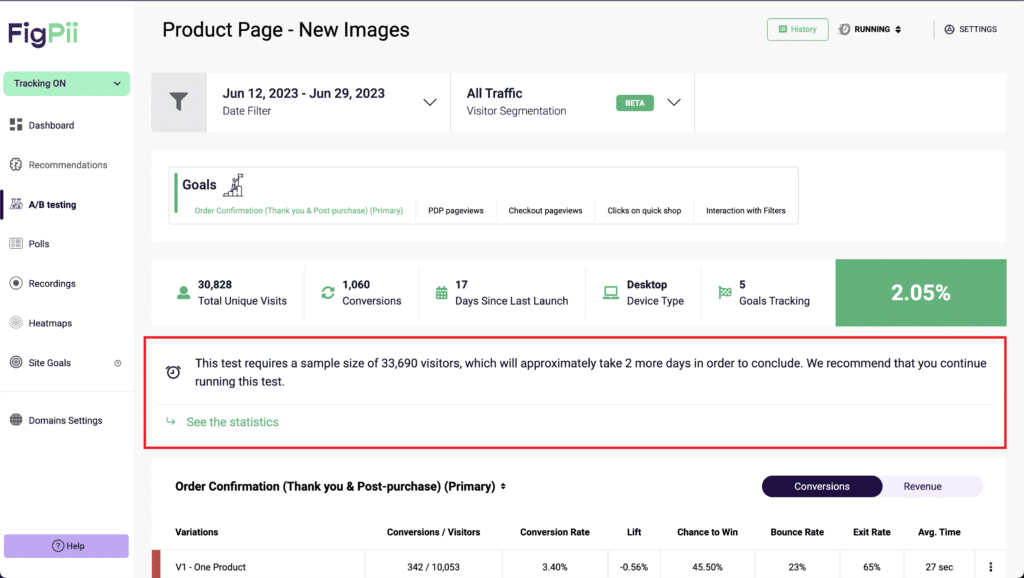 FigPii’s A/B testing engine also suggests how much sample size your test requires and how many days until you can get significant results.
-
A/B Testing Tools and Platforms
A/B testing tools, like Figpii, often have built-in sample size calculators. These tools simplify the process of determining the sample size by providing automated calculations based on predefined parameters.
They consider factors such as statistical power, confidence level, and expected effect size.
A/B testing tools allow you to set your desired confidence level and other relevant parameters and provide recommendations for the appropriate sample size.
-
Pilot Testing
Conducting a pilot test with a smaller sample size can help you gather preliminary data and estimate the effect size and variability in your target metrics.
This information can then be used to calculate the minimum sample size required for the full-scale A/B test. Pilot testing allows you to understand the expected results and can help refine your sample size estimation.
-
Expert Consultation
If you have access to statisticians, data scientists, or experts in conversion optimization, seeking their guidance and expertise can be invaluable.
They can help you analyze the specific context of your experiment, consider the relevant statistical parameters, and provide recommendations for determining the appropriate sample size.
Expert advice can ensure that your sample size calculation aligns with best practices and statistical rigor.
Considerations for Practical Sample Size Determination
-
Time and resources available
A larger sample size generally requires more time and resources to collect and analyze the data. You may need to balance the desired sample size and practical constraints if you have limited time or resources.
Find a feasible sample size within the given time frame and resource constraints without compromising the statistical integrity of the results.
-
Balancing statistical requirements with practical constraints
While statistical significance and precision are important, you must ensure the sample size is practical and feasible within your context.
It’s essential to find a sample size that satisfies both the statistical rigor and the practical limitations you may encounter.
-
Available Sample Population
Consider the size and characteristics of the available sample population when determining the sample size.
If your target population is limited in size, you may need to adjust your sample size accordingly to ensure the representativeness and generalizability of the results.
Additionally, if the general population is small, you might need to balance the sample size to avoid oversampling or exhausting the population too quickly.
-
Level of Precision Required
The precision required in your A/B testing results also determines the sample size. Consider the degree of accuracy you need to make informed decisions based on the data.
A higher level of precision generally requires a larger sample size. However, you should also consider the trade-off between precision and practicality.
Finding a balance that provides sufficient precision without exceeding resource limitations is important.
-
Feasibility of data collection
Think about the practical aspects of data collection, such as the ease of implementation, the accessibility of data sources, and the availability of necessary tools and technologies.
If data collection poses significant challenges or if it’s impractical to collect a large sample size, you may need to adjust the sample size accordingly to ensure feasibility while maintaining statistical validity.
Consequences of Insufficient Sample Size
-
Increased risk of Type I or Type II errors
Insufficient sample size increases the risk of Type I and Type II errors when running your A/B test. Type I error occurs when you falsely reject the null hypothesis and conclude that there is a significant difference between variations when there isn’t one.
On the other hand, type II error occurs when you fail to reject the null hypothesis and conclude that there is no significant difference when there is.
-
Inaccurate or Misleading Results
With an insufficient sample size, the results of your A/B test may not accurately reflect the true behavior of your target population.
The sample might not be representative enough to capture the true variability and characteristics of the larger population.
Consequently, the results may be biased or misleading, leading to incorrect interpretations and potentially flawed decision-making.
-
Reduced Statistical Power
A small sample size reduces the statistical power of your A/B test. Statistical power is the probability of detecting a true effect or difference when it exists.
With a smaller sample size, the ability to detect meaningful differences between variations diminishes, resulting in reduced statistical power.
This means that even if there are genuine differences between variations, you may fail to detect them due to the limited sample size. Insufficient statistical power undermines the credibility and effectiveness of your A/B testing.
-
Wasted Time and Resources
Conducting an A/B test with an insufficient sample size can result in wasted time and resources.
Insufficient sample size may lead to inconclusive or inconsequential results that provide little value or actionable insights.
It may require additional rounds of testing, prolonging the experimentation process, and consuming additional resources.