HeatMapsx
See Where Your Website Shines and Where it Needs Improvement
![]() Visualize User behavior
Visualize User behavior
![]() Spot Areas of Struggle
Spot Areas of Struggle
![]() Monitor Crucial User Metrics
Monitor Crucial User Metrics
![]() Improve Conversion Rates
Improve Conversion Rates
All features unlocked. No commitment. No credit cards.
Trusted by 3700+ Brands


Trusted by 3700+ Brands
FigPii Is A Trusted User Behavior Platform. And We Have Receipts to Prove It.
3700+
Brands use FigPii for
their user behavior analysis
99%
Of users feel
secure using FigPii
127
Countries are home to brands that use FigPi
99.99%
Operating time.
FigPii won’t let you down!
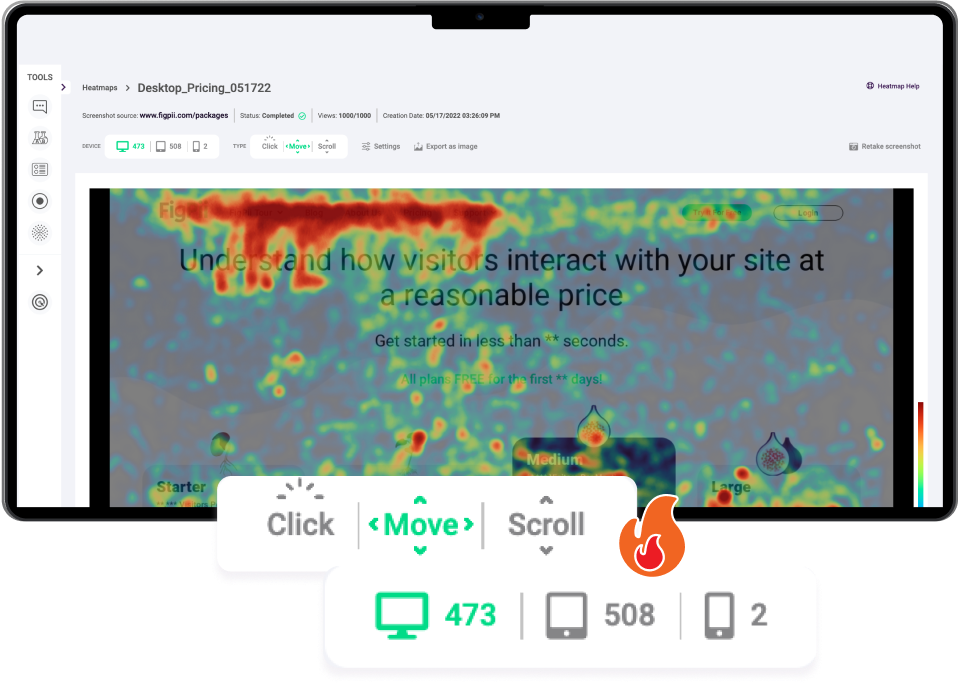
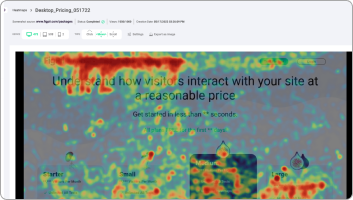
Uncover Missed Revenue Opportunities
FigPii heatmap report reveals high-attention areas on your website. Use it to eliminate distractions and increase revenue-generating actions.
![]() Click heat maps
Click heat maps
Identify the most popular areas of your website, and see where users are most likely to click and engage.
![]() Move heat maps
Move heat maps
Understand how users are interacting with your website, and identify areas that are confusing or frustrating for users
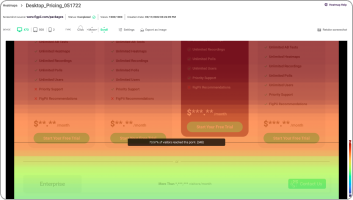
![]() Scroll heat maps
Scroll heat maps
See how far users are scrolling down a page before leaving, and know the exact areas that need improvement.
What Makes FigPii Special?
FigPii Give You Access To More Optimization Tools
![]() Session Reccordings
Session Reccordings
Step into your users' digital footsteps, see exactly how they interact with your website and get a sense of their experience so you can make it better.
Learn More![]() A/B Testing
A/B Testing
FigPii's powerful testing platform is designed to be fast, user-friendly, and packed with all the essential features you need to streamline your testing process.
Learn More![]() Polls & Surveys
Polls & Surveys
FigPii enables you to create polls and surveys, gathering vital feedback and detecting response patterns.
Learn MoreQuestions You Can Answer Using FigPii
Which parts of the website are being ignored by users?
Heat maps can show you which parts of your website are being ignored by users. You can use the insights to identify areas that may need to be redesigned or removed to improve user engagement and reduce frustration.
How far down the page are users scrolling before losing interest?
Heat maps can help you determine how far down the page users are scrolling before losing interest. This helps you identify which parts of the page are most engaging and which parts may need improvement.
Which design elements are most effective in capturing users' attention?
Using FigPii heat maps you can identify the most effective elements that peeks user interest, helping you to optimize your site's design in a way that increases engagement and drive conversions.
Which areas of the website are receiving the most clicks?
Heat maps can show you which areas of your website are receiving the most clicks from users. This information can help you identify which links or buttons are most effective in capturing users' attention and driving engagement.
Still On The Fence About FigPii?
Take FigPii for a test drive with our no-risk, it's completely free!
Or schedule a personalized demo with our team.