

When it comes to conversion optimization, data plays a significant role in helping businesses make informed decisions and achieve better results.
Think of data as an essential tool in your toolbox, empowering you to understand your audience, track their behavior, and uncover valuable insights that can drive conversions.
Imagine starting an online store without any knowledge of your potential customers’ preferences, shopping patterns, or even which products are most popular. It would be like shooting in the dark, hoping to stumble upon the right strategies to entice customers and close sales.
Data allows you to shed light on your website visitors, their interactions, and their journey toward conversion. It reveals invaluable information about what elements of your website are engaging, what content resonates with your audience, and what might hinder their conversion process.
This article will discuss quantitative and qualitative data and their importance in conversion rate optimization.
The Role of Quantitative and Qualitative Data in Conversion Optimization
Qualitative and quantitative data play vital roles in conversion optimization by providing valuable insights from different perspectives.
Quantitative data offers measurable statistics and metrics, allowing you to identify trends, patterns, and areas of improvement in the conversion process. It provides a quantitative foundation for data-driven decision-making.
On the other hand, qualitative data offers subjective insights into user behavior, motivations, and pain points. It helps uncover the ‘why’ behind user actions, providing a deeper understanding of the user experience.
By combining both types of data, you can understand your audience comprehensively, enabling you to make informed optimizations that enhance user engagement and boost conversion rates.
Quantitative Data: Unveiling the Numbers


Quantitative data, in the context of conversion optimization, refers to numerical and measurable information that provides statistical insights into user behavior and other factors affecting the conversion rate.
It involves collecting data from various sources, such as analytics tools, tracking software or website metrics, and analyzing it to gain quantitative insights.
For example, quantitative data may reveal that many visitors abandon their shopping carts at the payment stage. This insight prompts you to investigate the underlying causes and find solutions to optimize the checkout process, potentially leading to a higher conversion rate.
Here are some examples of questions that are considered quantitative in conversion optimization:
- What is the overall conversion rate of our website?
- How many visitors are landing on our product pages?
- What is the average time spent on our website?
- What is the bounce rate for our landing pages?
- What is the cart abandonment rate on our website?
- How many visitors complete the checkout process?
Sources of Quantitative Data in Conversion Optimization[a]
-
Website Analytics
Website analytics tools, such as Google Analytics 4, provide a wealth of quantitative data on user behavior, traffic sources, conversion rates, and more.
Website analytics help you understand user engagement, measure the impact of optimization efforts, and make data-driven decisions to improve conversions and enhance the user experience.
-
Heatmaps
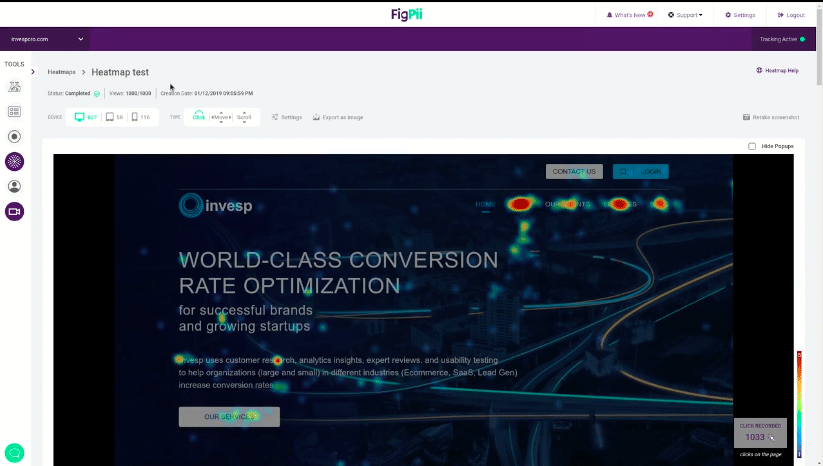
The data from heatmaps help identify hotspots, click patterns, and areas where users may encounter difficulties or lose interest. By analyzing heatmaps, businesses can gain insights into user behavior and identify areas that need improvement to enhance the user experience.
-
Session Recording
Session recordings provide playback of user interactions, including mouse movements, clicks, scrolls, and navigation paths. These recordings are super handy because they give you a real-life view of how users are experiencing your website or app.
You can see where they get stuck, where they hesitate, or where they just bounce off.
-
Conversion Funnel Tracking
Tracking the conversion funnel allows you to understand the user journey from the initial touchpoint to the final conversion action.
You can track conversion funnels to identify stages where users drop off and take measures to optimize those stages.
This data helps you optimize the funnel by streamlining the user experience and removing barriers to conversion.
-
CRM Systems
Customer Relationship Management (CRM) systems provide valuable quantitative data on customer interactions, purchases, and preferences.
You can gain insights into customer behavior, identify cross-selling or upselling opportunities, and personalize the user experience when you analyze data from CRM systems.
-
Customer Surveys
Customer surveys provide a direct way to collect quantitative feedback from your audience.
Creating surveys with targeted questions allows you to gather insights into user preferences, satisfaction levels, and pain points.
Analyzing survey responses allows you to quantify customer opinions, identify areas for improvement, and prioritize optimization efforts.
Key quantitative data metrics in conversion optimization
-
Conversion rates
Conversion rate is one of the essential data metrics used in conversion optimization. A higher conversion rate indicates a successful conversion optimization strategy, while a lower rate suggests you must up your conversion strategy.
-
Click-through rates
Conversion optimization is a step-by-step process that isn’t complete until a user takes the desired action, even just clicking a button.
CTR is a crucial metric in understanding the effectiveness of your website’s navigation, content relevance, and the clarity of your messaging.
A higher CTR suggests that users engage with your content and take the desired actions. On the other hand, a low CTR may indicate visibility, relevance, or user experience issues.
-
Bounce rates
A high bounce rate typically suggests that visitors need help finding what they’re looking for or encountering obstacles that prevent them from engaging further.
It could be due to slow loading times, confusing navigation, irrelevant content, or poor user experience.
All these hurdles will significantly impact your conversion rate, making bounce rate a key data metric to look out for during conversion optimization.
-
Time on Page
Time on page gives insights into user engagement and interest in your content. A longer time on a page indicates that visitors spend more time consuming the information, indicating a higher level of engagement.
Of course, you don’t have to check the time on page for all the pages of your website. You should focus on the pages designed to engage customers and drive conversions.
-
Cart Abandonment Rate
Cart abandonment rate is a key quantitative data metric used in conversion optimization that provides insights into the effectiveness of the checkout process and highlights potential barriers or friction points that deter users from converting.
Qualitative Data: Exploring the Human Element


Qualitative data refers to non-numerical, subjective insights that provide a deeper understanding of user behavior, motivations, and preferences.
Qualitative data is more subjective and focused on understanding the “why” behind user behavior. It involves gathering insights through user surveys, interviews, and usability testing. It helps uncover your audience’s motivations, preferences, and pain points.
Sources of qualitative data in conversion optimization
-
User interviews
User interviews involve one-on-one conversations with your target audience. Through interviews, you can gain in-depth insights into their thoughts, motivations, and challenges.
Ask open-ended questions and actively listen to their responses. User interviews can uncover valuable insights that quantitative data may not reveal.
To get the most out of your User Interviews, you can employ the JTBD theory. When it comes to Jobs-to-be-Done interviews, the main aim is to dig deep and truly understand the job the customer is trying to accomplish with your product.
This job a customer is trying to accomplish could be functional, social, or emotional.
- Functional Jobs: Functional jobs refer to practical tasks or problems customers are trying to solve.
- Social Jobs: Customers often seek products or services that help them feel accepted or recognized by others.
- Emotional Jobs: Emotional jobs pertain to the feelings, desires, and psychological needs that customers want to satisfy.
By understanding these concepts, you can design products, produce content and offer services that address your customers’ needs.
-
Surveys
Conducting user surveys is an effective way to gather qualitative feedback at scale. Design targeted surveys that ask users about their experiences, preferences, and suggestions for improvement.
Analyze the survey responses to identify common themes, pain points, and opportunities for optimization.
-
User testing
User testing involves observing participants interacting with your website or specific features. Provide them with tasks or scenarios and carefully observe their behavior and feedback. User testing helps identify usability issues, confusion points, or areas where users get stuck.
-
Session recordings
Session recordings capture the actual user sessions on your website, allowing you to observe user behavior in real-time. You can see how users navigate, interact, and engage with your website by watching session recordings.
This qualitative data can reveal usability issues, engagement patterns, and improvement areas.
-
Customer Support Feedback
Your customer support team interacts directly with users, making them a valuable source of qualitative feedback.
Gather insights from customer support interactions, such as common user complaints, challenges, or feature requests. This feedback can help you uncover and address pain points to enhance the user experience.
When to Use Quantitative Data
-
When Tracking Conversion Rates
Quantitative data is essential when tracking conversion rates. When you monitor conversion rates over time, you can identify trends, patterns, and areas that require improvement.
-
During A/B Testing
Quantitative data is crucial in A/B testing as it allows you to measure specific metrics for each variation, such as click-through rates, conversion rates, or time on the page. With these metrics, you can identify which version performs better.
-
Funnel Analysis
When analyzing the conversion funnel, quantitative data can be handy. You can gather quantitative insights into drop-off points, conversion rates, and user engagement by tracking user behavior at each funnel stage. This data helps you identify potential bottlenecks and areas that require optimization.
-
Identifying Traffic Sources
Analyzing quantitative data from sources like Google Analytics can help determine which channels drive the most traffic to your website.
This information allows you to allocate resources effectively, prioritize optimization efforts, and tailor your marketing strategies to maximize conversions.
-
Performance Benchmarking
Quantitative data is crucial when benchmarking your website’s performance. You can gain insights into how well your website is performing by comparing key performance indicators with industry standards or competitors.
When to Use Qualitative Data
-
Understanding User Motivations
Qualitative data is valuable for understanding your users’ underlying motivations and preferences. Knowing why users behave in a certain way is essential when optimizing conversions.
-
When Gathering Feedback on new features
Before launching new features or design changes, collecting qualitative feedback can help you assess their potential impact on conversions.
Conduct user testing sessions or gather feedback through surveys or interviews to understand how users perceive and interact with the new elements.
This allows you to refine and optimize the new features based on user input, improving conversions when implemented.
-
Validating Quantitative Findings
Quantitative data provides valuable statistical insights but may not always tell the story. You can use qualitative data to validate and complement the findings from quantitative analysis.
This combination of qualitative and quantitative data lets you better understand the issues impacting conversions and guides your optimization efforts more effectively.
-
When Preparing to run A/B Tests
Before conducting A/B tests, leveraging qualitative data can help inform the design and content variations you test.
When you understand user perspectives from qualitative methods, you can create A/B test variations that target specific pain points or address user needs.
This ensures that your A/B tests are focused on optimizing conversions based on qualitative insights.
Qualitative vs. Quantitative Data Which One Should You Prioritize
When deciding which type of data to prioritize, whether qualitative or quantitative, it’s important to consider your specific conversion optimization goals and the insights you seek.
Both qualitative and quantitative data have unique advantages and can provide valuable information. Here’s a practical approach to determining which to prioritize:
-
Start With Your Objectives
Clarify the specific goals you aim to achieve through conversion optimization.
Are you seeking to understand user motivations, identify pain points, evaluate the effectiveness of design changes, or measure the impact of marketing campaigns?
Defining your objectives will help guide your data collection strategy.
-
Consider The Dept of Insights
Qualitative data allows in-depth exploration of user experiences, motivations, and preferences.
It can provide nuanced insights and uncover underlying reasons behind user behavior. If you want to understand the “why” and gain rich context, prioritize qualitative data.
-
Consider the Scale and Representativeness
Quantitative data is often collected at a larger scale, providing a broader view of user behavior and statistical significance.
If you need to analyze trends, compare performance across different segments, or track changes over time, prioritize quantitative data. It offers a robust and representative sample to help identify patterns, correlations, and statistically significant insights.
-
Time and Resources Constraints
Assess the time and resources available for data collection and analysis. Qualitative data collection methods, such as user interviews or usability testing, typically require more time and resources than quantitative methods like website analytics or A/B testing.
If you have limited time and resources, prioritizing quantitative data can provide quick and actionable insights that can be implemented promptly to optimize conversions.
-
Iterative Optimization Approach
Consider the stage of your conversion optimization process. If you are in the early stages and seeking to understand user needs, preferences, and pain points, prioritizing qualitative data can help you gain foundational insights.
This qualitative understanding can then inform the design and implementation of quantitative data collection and analysis methods as you progress toward iterative optimization.
Combining Quantitative and Qualitative Data
-
Qualitative Data Adds Context to Quantitative Insights
While quantitative data provides numerical metrics and trends, qualitative data adds depth and context to those insights. By combining both, you can understand the “why” behind the numbers and gain a more comprehensive understanding of user behavior.
For example, if your website analytics show a high bounce rate on a particular page, qualitative data from user feedback or interviews can help uncover the reasons behind the behavior.
-
Validation and Triangulation
You can validate and triangulate your findings by combining qualitative and quantitative data.
Qualitative data can help validate the trends and patterns observed in quantitative data by providing real-life user experiences and perspectives. Triangulation, which involves cross-verifying data from different sources, adds credibility to your insights.
-
Uncovering User Pain Points and Usability Issues
Quantitative data may reveal performance metrics and trends, but qualitative data is invaluable for uncovering specific pain points and usability issues.
Through user testing, surveys, or interviews, qualitative data can identify frustrations, confusion, or barriers users face during their interactions. This information can help you prioritize improvements by addressing these pain points directly.
-
Generation of Ideas and Hypotheses
Qualitative data provides rich insights into user preferences, motivations, and needs, which can fuel idea generation and hypothesis formation.
For example, user feedback might reveal a desire for additional product information or a more intuitive checkout process, which can inspire ideas for A/B testing or other optimization strategies.
-
Fosters User-Centric Optimization
By combining quantitative and qualitative data, you can adopt a more user-centric approach to optimization.
Quantitative data provides an overall picture of user behavior, while qualitative data allows you to understand the emotions, motivations, and experiences that drive that behavior.
This user-centric perspective helps you prioritize optimization efforts that align with user needs and preferences, ultimately leading to better conversions and a more satisfying user experience.
Moving Forward
The power of quantitative and qualitative data lies in their complementary nature. While quantitative data provides statistical evidence and helps you identify trends, qualitative data provides the necessary context and helps you understand the user’s perspective.
So, whether you’re an e-commerce store, a service provider, or a CRO Specialist, data-driven conversion optimization is your compass for success. It enables you to understand your customers better, tailor your strategies, and ultimately drive more conversions.