

Behavior analytics tools are essential for Shopify owners to improve their website’s user experience and ultimately increase conversions.
These tools provide valuable insights into user behavior and help you optimize your website accordingly.
In this article, we’ll explore some of the best behavior analytics tools available for Shopify brands, including their unique features, pros, cons, and pricing.
Before we start, here’s a quick overview of the tools we’ll discuss in more detail in the article.
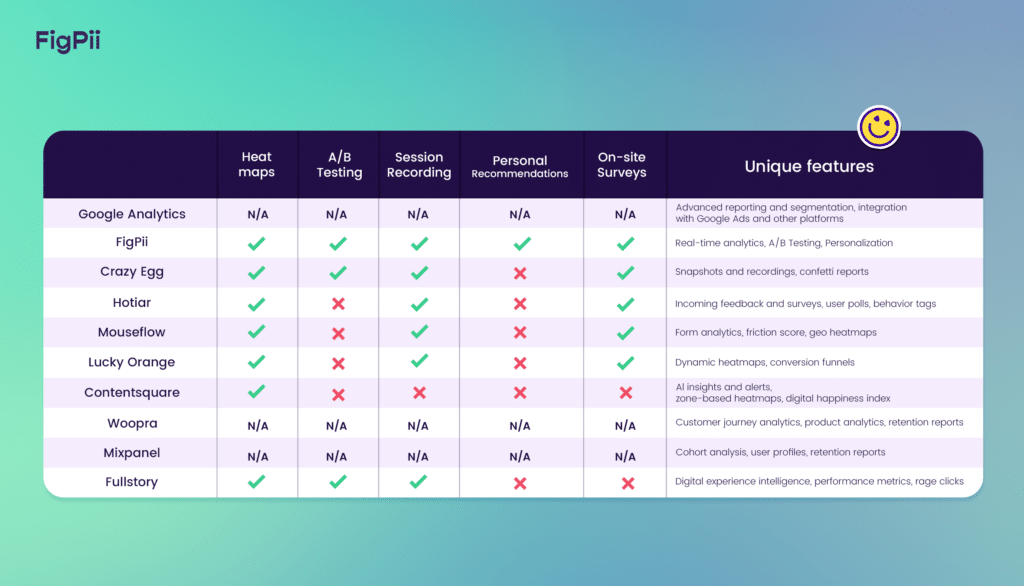
Here’s a more detailed review of these behavioral analytics tools for Shopify brands:
Top 10 Behavior Analytics Tools For Your Shopify Brand
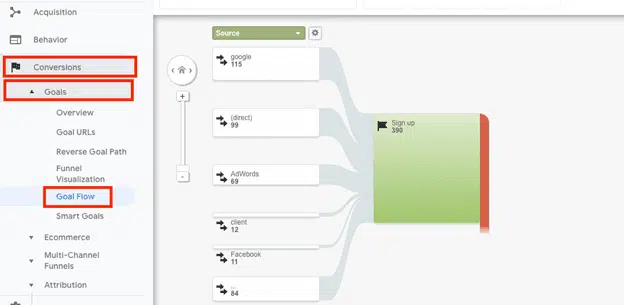
1. Google Analytics
Google Analytics is a free tool that helps you track visitors, sessions, customer lifetime value, customer retention, and other customer analytics on your Shopify store.
Aside from uncovering user behavior patterns, you can also use it to measure your marketing campaigns, optimize your store design, and improve your conversion rates. Another bonus is that since it’s a Google product, it integrates well with Google Ads, Google Tag Manager, and other Google products.
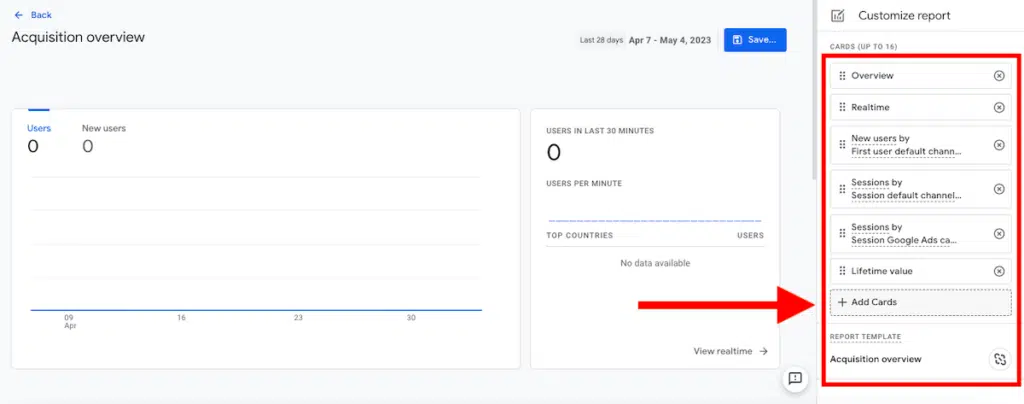
One of its standout features is the ability to create custom reports tailored to your business goals and needs. You can choose which metrics to include, how to segment data, and how to visualize results.
Also, Google Analytics recently evolved from Universal Analytics to Google Analytics 4, which is Google’s next-generation measurement solution. This new version offers more features, including cross-device tracking, enhanced ecommerce reporting, predictive analytics, and more.
Some of its key features and workflows include:
- Traffic acquisition: Identify channels that are driving traffic to your store, including organic search, social media, or paid advertising.
- User behavior tracking: Track how users navigate your website, which pages they visit, how long they stay, and where they drop off.
- Conversion tracking: Set up conversion goals and track how users move through the conversion funnel – from their initial visit to the final purchase.
- Reporting and analysis: Create custom reports, segment data, and analyze trends and patterns in user behavior.
Pros:
- It’s completely free of cost.
- The interface is intuitive and easy to use. It’s also easy to set up and integrate with Shopify.
- You can manage multiple websites under the same account.
- It integrates well with other tools in the Google ecosystem, including Google Ads, Google Tag Manager, and more.
Cons:
- It can have limited functionality compared to more advanced (and paid) analytics tools. For example, it lacks more advanced tools like attribution, heatmaps, and the like.
Pricing:
Entirely free of cost.
2. FigPii
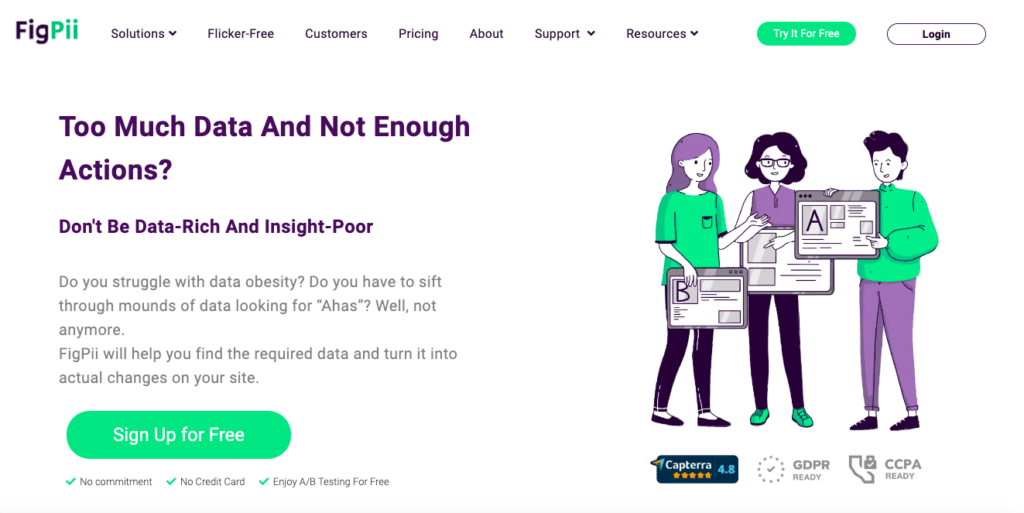
With its recommendation features and multiple conversion optimization tools, FigPii goes beyond regular data analytics reports. It uses machine learning to suggest actual changes you can make on your site to improve your conversion rates. It also offers AI-powered A/B testing, heat maps, and session replays with an easy-to-use interface.
One of its standout features is the real-time analytics. This means you can see what users are doing on your website as they do it. This will help you pinpoint issues or opportunities as they arise and take action quickly.
Additionally, FigPii provides analytics across multiple channels, including desktop, mobile, and social media. This gives you a complete picture of how users interact with your brand, which is invaluable when it comes to optimizing your online presence.
Some of its key workflows include:
- A/B Tests: It helps you create and run A/B tests on your Shopify store using a visual editor or custom code. You can also analyze your A/B test results using statistical significance, confidence intervals, and revenue per visitor metrics. In addition, you can track multiple A/B testing goals for your experiments.
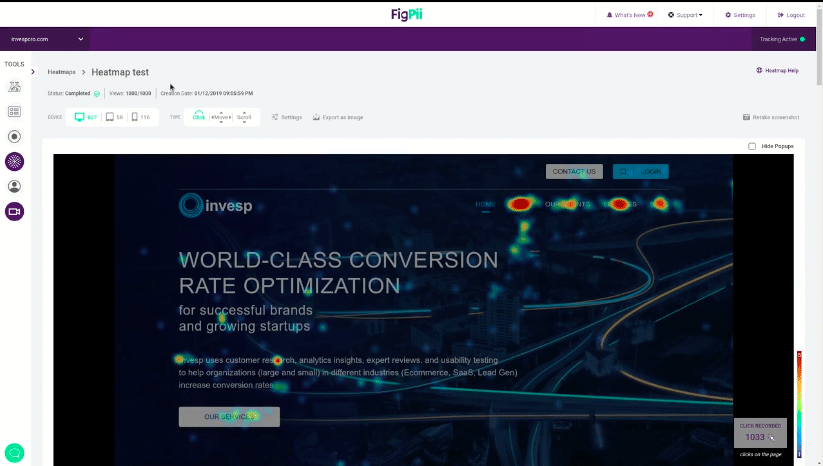
- Heat maps: You can view heat maps of your Shopify store pages to see where users click, move their mouse, and scroll.
- Session replays: Record and replay user sessions on your Shopify store to see how they navigate, interact, and behave on your site.
- On-site polls: You can create and launch polls on your Shopify store to collect instant user feedback and insights.
Pros:
- It offers all user optimization tools in just one place, so you don’t have to worry about your data on different platforms or oscillating between different marketing platforms.
- Competitive price for such functionality.
- Online reviews suggest that FigPii has excellent customer support. The support team is ready to answer any questions, consider any feature requests and explain things that are not clear.
Cons:
- The interface could be more modern and intuitive.
Pricing:
It offers four pricing plans:
- Free Tester: Free for 75,000 visitors/month with lifetime access, unlimited A/B tests, and unlimited user access.
- Small: $99.99/month for 30,000 visitors/month with unlimited features.
- Medium: $199.99/month for 60,000 visitors/month with unlimited features.
- Large: $339.99/month for 100,000 visitors/month and unlimited features, along with the FigPii Recommendations tool.
You can also get a custom quote if you have over 1,000,000 visitors/month and specific needs.
3. Crazy Egg
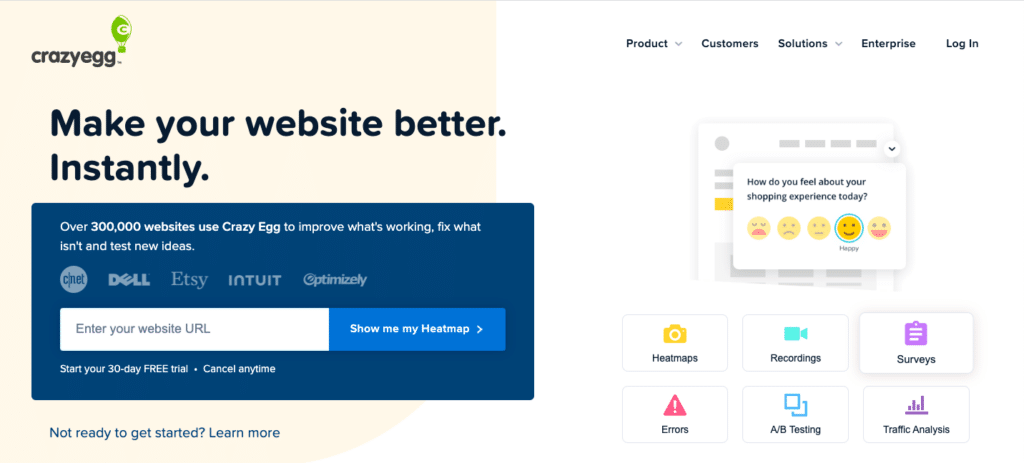
Like FigPii, Crazy Egg is another behavior analytics and website optimization tool for Shopify brands that want to improve their website performance and user experience.
One of the unique things about Crazy Egg is their confetti and overlay heat map reports – in addition to the regular scroll maps and click reports. You can see where visitors click, scroll, and drop off, helping you make data-driven decisions.
It also comes with a built-in A/B testing tool, allowing you to experiment with store design and content changes and see what increases conversions.
Other key features and workflows include:
- Session recordings: It lets you watch recordings of actual visitor sessions to see how they navigate through your store and where they encounter frustration or confusion.
- Traffic analysis feature: You can see how different sources of traffic behave on your store and optimize your marketing campaigns accordingly.
- Error tracking feature: It helps you detect and fix any technical issues that affect your store performance or user experience.
- User surveys: You can collect user feedback to gauge their needs and preferences better.
Pros:
- Reasonable pricing, especially considering the features.
- It’s easy to set up and use.
Cons:
- It does not offer more advanced features like multivariate testing, segmentation, or funnel analysis.
- Some users have reported issues with the accuracy of the data, the loading speed of the reports, and customer support.
Pricing:
Pricing plans start from $29 per month for up to 30,000 page views, 25 snapshots, and 100 recordings per month.
4. Hotjar
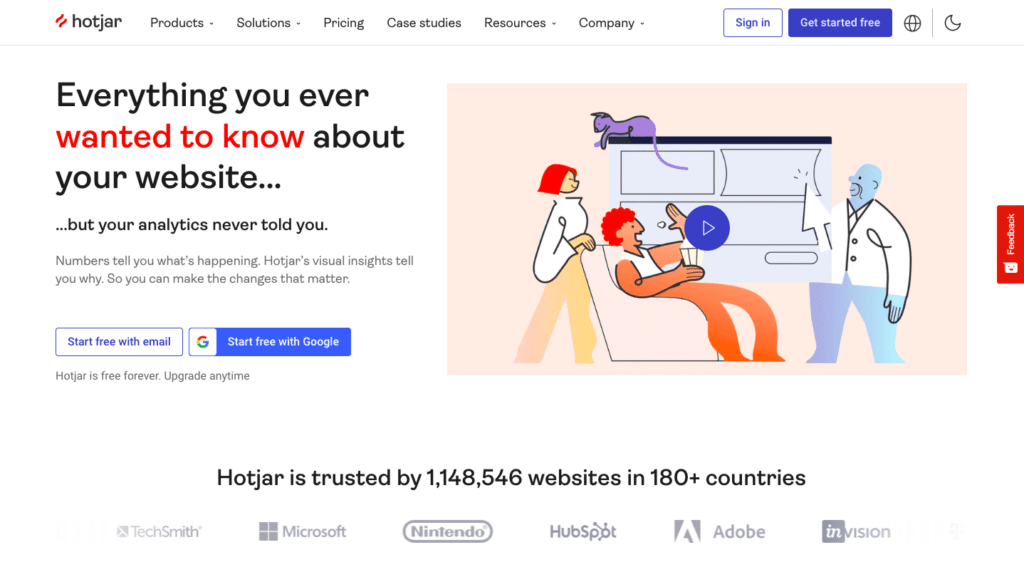
Hotjar offers a wide range of features to analyze user behavior and feedback on your Shopify store. These include heat maps, scroll maps, click maps, confetti maps, session recordings, surveys, polls, feedback widgets, and incoming feedback.
All these features, when used together, help you see how visitors interact with different elements on your store pages and identify problem areas or opportunities for improvement.
While feedback widgets help you get comments directly from users on how they feel about specific elements in your store, the “Incoming Feedback” feature helps you discover when users rage-click and leave feedback.
Another standout feature is Hotjar’s conversion funnel feature, which helps you track visitors’ steps on your website and identify where they drop off or exit the funnel.
In addition to this, Hotjar lets you segment your data by device type, browser, country, traffic source, and more.
Pros:
- It offers a free plan for personal use or low-traffic websites.
- It’s easy to set up and use.
Cons:
- Complicated pricing structure.
- It has some limitations on the number of surveys you can create per site.
- It may slow down your website loading speed if you use too many features at once.
Pricing:
Paid plans start from $32 monthly but only for up to 100 sessions daily. The plan is also limited to heat maps and session recordings. There are different pricing plans/charges for other behavior analytics tools like surveys, feedback widgets, and the like.
5. Mouseflow
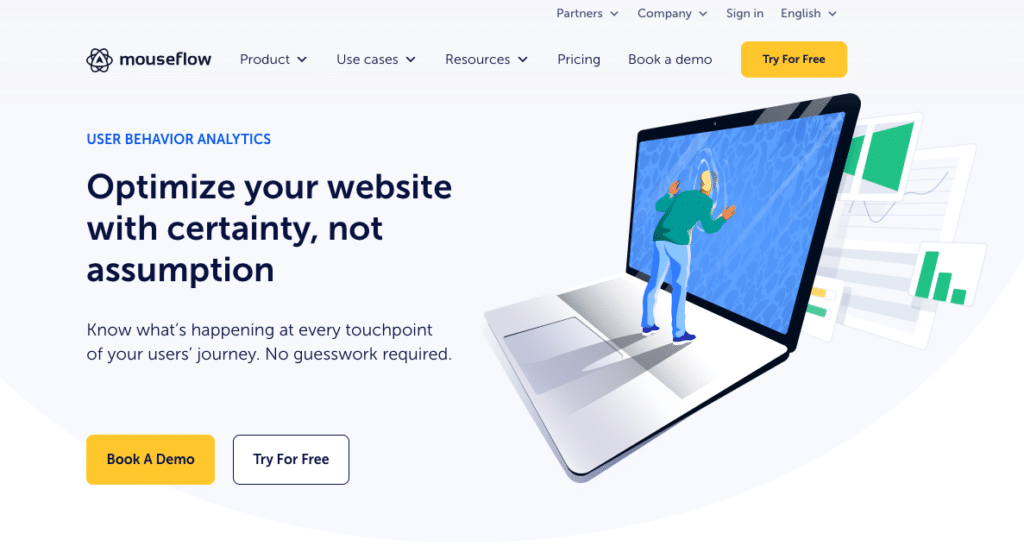
Mouseflow offers a range of features that let you analyze your website’s traffic in depth. You can view heatmaps of individual pages, compare different versions of your landing pages, and track specific events such as clicks on buttons or form submissions.
One of Mouseflow’s unique features is its funnel analysis tool, which allows you to track and analyze user behavior through specific sequences of pages, such as a checkout process.
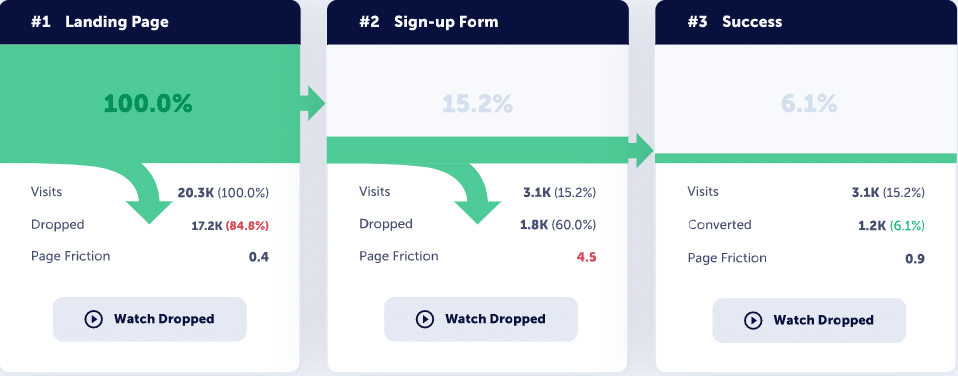
It also comes with a form analysis tool that can help you identify and troubleshoot issues with form submissions. For instance, it provides insights into where users drop off or encounter errors.
Pros:
- Mouseflow has a proprietary friction score feature that helps you measure site visitors’ frustration levels. It’s calculated based on the occurrence of seven friction events, including click-rage, click-error, bounce, speed-browsing, mouse-out, mobility, and custom friction.
Cons:
- The starter pricing plan allows only up to 5000 recordings.
Pricing:
Starts from $31 per month when paid annually but only for 5000 recordings per month. There’s also a free plan that allows up to 500 recordings per month.
6. Lucky Orange
Lucky Orange offers a range of features to help you gauge potential customers’ behavior on your site, including heatmaps, session recordings, chat functionality, surveys, and conversion funnels.
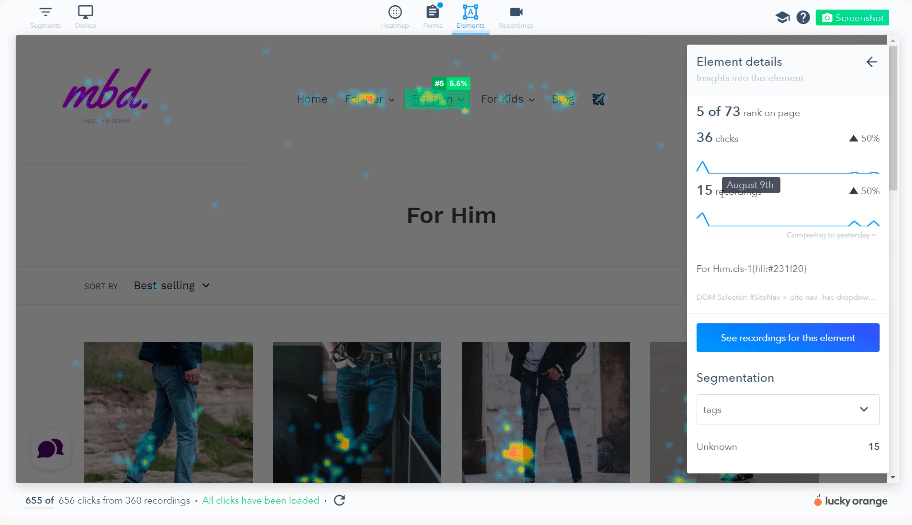
One standout feature is its dynamic heatmaps, which show real-time clicks, scrolls, and mouse movements along with element details.
Lucky Orange also includes a form analytics tool, which helps identify form abandonment and areas for improvement.
Overall, it’s suitable for all Shopify brands looking to optimize their website user experience and improve conversion rates. However, it may not be the best fit for businesses with very low website traffic since some features may not be as effective with limited data.
Pros:
- Lucky Orange’s dashboard provides a centralized location for accessing all features and data, allowing you to identify and address areas for improvement.
- It has a chat feature that allows you to engage with visitors and provide real-time support.
Cons:
- It may not be suitable for users who only need basic analytics or who have a limited budget.
- Some online reviews have complained about issues with loading speed.
Pricing:
Pricing starts from $14 per month (if you choose to pay annually) for up to 10,000 Pageviews/month. A free plan also allows up to 500 page views per month.
7. Contentsquare (formerly Clicktale)
Contentsquare comes powered with behavior analytics features like heat maps, session recordings, and visualizations of user journeys.
One feature that makes Contentsquare stand out is its “zoning” capability, which allows businesses to isolate and analyze specific parts of their website in detail. Contentsquare also uses machine learning to provide automated insights and recommendations for improving website performance.
Here’s a quick overview of its key features and workflows:
- You can use it to identify how your product catalog performs across channels and the impact of product placement, price, stock, and cross-selling on your revenue.
- Identifying and fixing errors and user frustrations, including slow page speed, broken links, or poor usability.
- Optimizing your web design and layout based on zone-based heatmaps, form analysis, session replay, and journey analysis.
Pros:
- It provides a comprehensive and holistic view of your customer behavior and digital experience.
- Uses machine learning to uncover hidden patterns and trends in user behavior.
Cons:
- Contentsquare may not be good for Shopify brands with a limited budget. It’s a premium solution that requires a custom quote based on your needs and goals.
- Can be overwhelming for novice users who are unfamiliar with analytics and data visualization tools.
Pricing:
Contentsquare does not have a fixed pricing plan or a free trial option. They offer custom quotes based on your needs and goals. You can request a demo or contact their sales team to get more information about their pricing.
8. Woopra
Woopra is a customer journey and product analytics tool that gives you a 360-degree view of each customer, gathering data from different touchpoints.
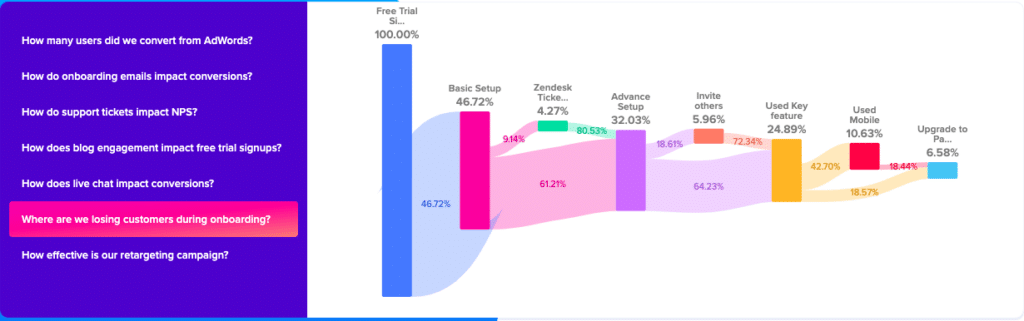
The platform helps you analyze customer journeys across different funnel stages, including acquisition, activation, retention, revenue, and referral. This can help you understand how customers interact with your brand and provide personalized experiences.
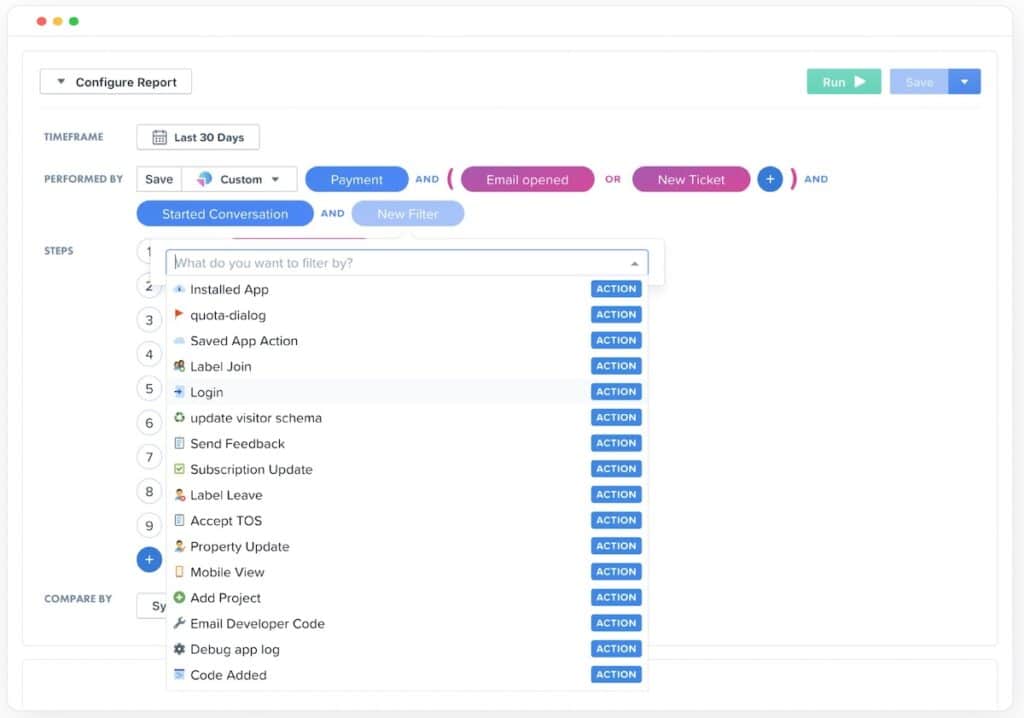
Woopra’s real-time segmentation is also worth noting. The segmentation feature allows you to segment customers in real-time based on behavior, demographics, and other factors. This can help you personalize messaging and offers for different customer segments.
Overall, Woopra is suitable for Shopify brands that want to understand customer behavior across multiple channels. However, it might be overkill for smaller brands with limited data, especially since its pricing can be expensive.
Pros:
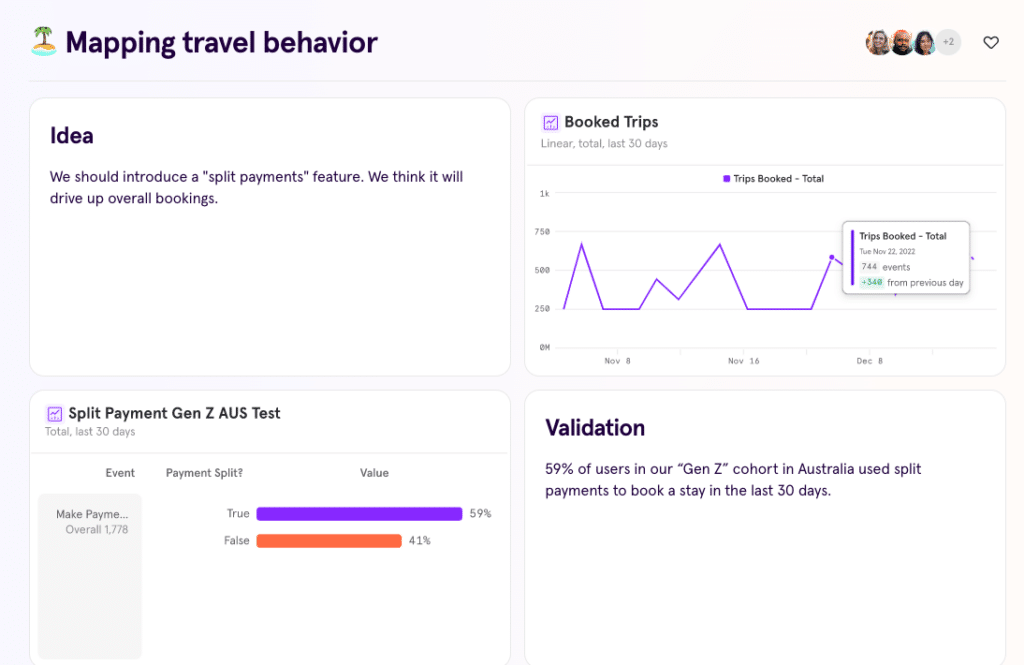
- Real-time customer profiles with behavioral data
- Advanced segmentation and filtering options
- Cohort analysis to track changes over time
- Predictive analytics to identify potential churn or high-value customers
Cons:
- Steep learning curve for new users
- Some features may require technical expertise to utilize fully.
Pricing:
Paid plans start at $999 per month for up to 5 million actions/month. There’s also a free plan that allows 500K actions/mo and a custom enterprise plan for larger businesses. A 14-day free trial is also available for new users.
9. Mixpanel
If you’re looking for a behavior analytics platform that can help you track how users interact with your website or app, then Mixpanel is the tool for you.
Mixpanel is an event-centric behavior analytics tool that focuses on user actions on the website, including adding items to a cart, viewing product details, or completing a purchase. This allows ecommerce owners to understand the customer journey and optimize their conversion funnel accordingly.
You can also use Mixpanel’s segmentation feature to group visitors based on their behavior or attributes like location, device type, referral source, etc. This will come in handy for comparing different user groups to understand their differences and similarities.
Mixpanel also integrates with Shopify seamlessly, using Zapier or SDKs, and lets merchants explore data without SQL.
Pros:
- The tool offers powerful segmentation and funnel analysis features to help you track user behavior across multiple touchpoints.
- You get access to real-time analytics, so you can see how users are interacting with your site or app in real time.
- Mixpanel has a strong focus on user privacy and data security, so you can be confident that your data is safe.
Cons:
- It can be expensive for larger organizations or those with high levels of traffic. Prices also increase exponentially based on your monthly event volume.
- Some users might also find the pricing model confusing or difficult to navigate.
Pricing:
Pricing starts from $20 per month for 10k events per month. The pricing increases depending on your event volume.
10. FullStory
Fullstory is a behavior analytics tool that uses digital experience intelligence to capture all the actions and events that happen on a website without needing any manual coding or tagging.
You can replay user sessions, track errors, create heatmaps, and accurately measure performance. You can also filter heatmaps by user segments, devices, browsers, etc., and compare different versions of your website.
The A/B testing feature is another bonus. You can run experiments and test different variations of your website design, layout, copy, etc., and measure their impact on user behavior and conversion rates.
Other key features include:
- Rage clicks: Identify when users are making rage clicks, which are rapid clicks on elements that are not working or responding. You can also see other dissatisfaction factors like dead clicks, error clicks, or thrashed mouse movements.
- Performance metrics: Measure your website’s speed and reliability using performance metrics that show how long it takes for pages to load, render, or become interactive. You can also gauge how performance affects user behavior and conversion rates.
- Funnel analysis: You can create and analyze conversion funnels that show how users move from one stage to another in their purchase journey. You’ll also get a glimpse into where they drop off or convert.
Pros:
- Fullstory offers an extensive set of features, giving a comprehensive view of user behavior.
- It has a user-friendly interface that allows users to segment and search data using natural language queries.
Cons:
- Fullstory can be expensive depending on the number of sessions and events you want to capture.
- It also has a steep learning curve if you’re unfamiliar with digital experience intelligence.
Pricing:
They offer custom pricing options.
That’s a Wrap
In conclusion, there are several powerful behavior analytics tools available for Shopify brands.
FigPii and Hotjar are great for those looking for a comprehensive set of features, including heatmaps and session recordings, while Mouseflow’s proprietary friction score feature makes it stand out.
FigPii also stands out as an all-in-one behavior analytics platform with inclusions like A/B testing, on-site surveys, funnel analysis, and more.
Lucky Orange is a great option for those who want easy-to-use features like live chat and dynamic heatmaps, while Contentsquare offers advanced data analysis tools like zone-based heat maps and machine learning-based insights.
Woopra’s powerful analytics capabilities make it a good fit for larger businesses, and Mixpanel’s focus on event-based tracking is great for tracking specific user actions. Finally, Fullstory’s DXI concept allows for the automatic tracking of user behavior and provides high-fidelity session replays.
Each of these tools has its own unique features and benefits, so it’s important to consider which one will best meet your business needs and budget.