

We’re all searching for the next awesome heatmap tool in 2021.
After 5 years of Google killing its Google Analytics heat map tool, the search is still on for the best one out there.
So we decided to help you guys out, we’ll help you set up a free heatmap to try for your website to replace the Google Analytics heat map tool.
We want to create a blog post for people who are searching Google Analytics Heat Map, to get them a free heatmap that they can try for themselves.
If you’re interested in seeing how your website’s visitors interact with it, then this article is for you.
We’ve discussed what’s a heatmap and all that you need to know about heatmaps in this blog, so make sure to check it out first!
Before we jump into FigPii’s heat map tool, let’s talk more about Google Analytics heat map one first.
Google Analytics Heat Map
As I said in my intro which is sad news, Google has killed its heat mapping tool in 2017.
If you try to install it you’ll get the most basic info that you can possibly imagine.
No colorful heatmaps, no detailed analytics, no easy-to-use interface, nothing.
Just a basic Google Analytics dashboard with no heatmap feature whatsoever.
The Google analytics heat map tool was very popular for years.
It gave users the opportunity of seeing how many pageviews and clicks each section on their website had received in an easy-to-navigate interface.
While yes Google has deprecated this extension, it sometimes works, if you’re lucky enough.
If you would like to try your luck I’ll run you through the install process.
Be sure to let us know if it works for you or not
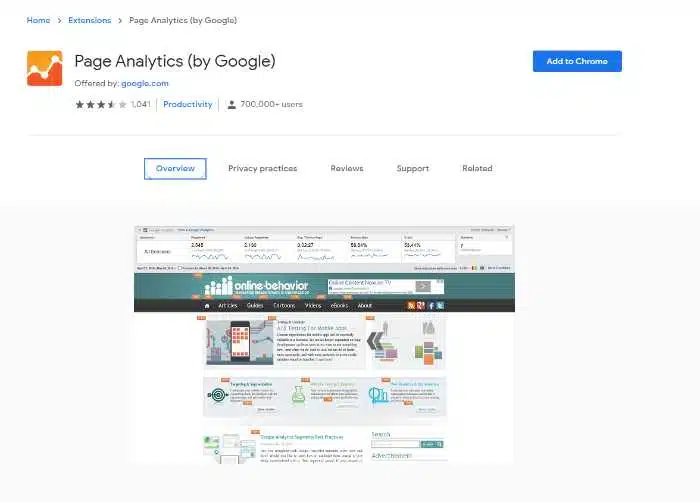
How to install Google Analytics Heat Map
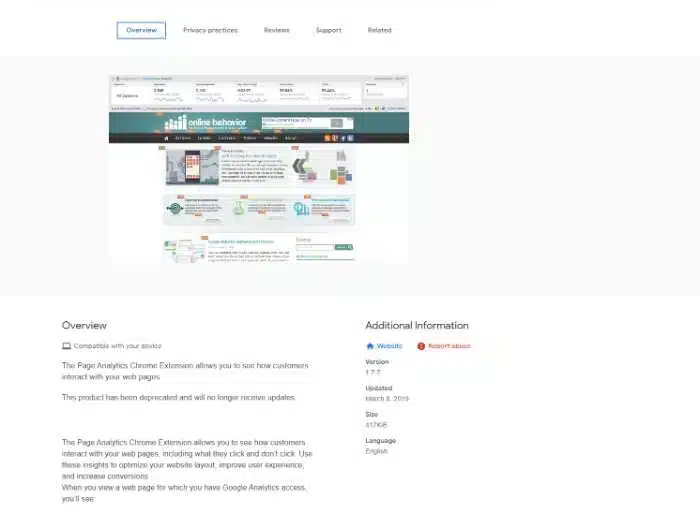
This is Google’s old heat map tool and it has been deprecated, so Google will not be updating or maintaining this extension.
However, if we’re lucky enough for it to work then follow the steps below:
Go on Google Chrome Web Store; Enter “Google Analytics Heat Map”; Click Install
That was easy! But now you’ll need your account in order to use Google Analytics.
If you don’t have one yet, remember that you can create a free Google Analytics account here.
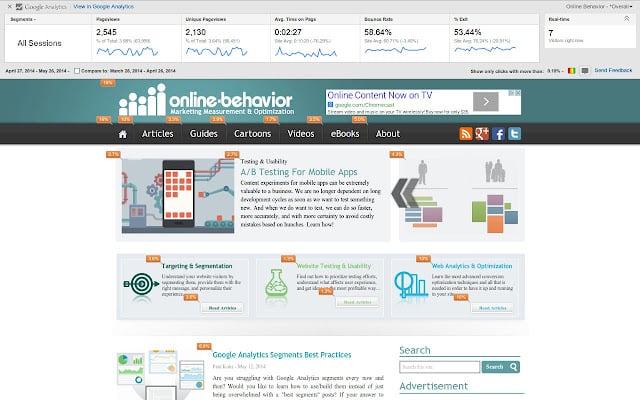
Once you’re in log in to your Google Analytics account.
Go to your website’s homepage, and you should see a Google Analytics overlay detailing the pageviews, bounce rate, and other analytics metrics.

If this works for you then you’re lucky, but if it doesn’t, well, that’s the expected.
but don’t worry, if you’re looking for a Google Analytics heat map, then I’m glad that you found this article.
If Google’s old tool is not working out for you it’s because hasn’t been updated since 2017.
Don’t worry we’ve got your back!
FigPii has created an awesome Google analytics heat map alternative and it’s free to use up until 14 days of sign-up. It also includes all the features from Google’s extension with more detailed analytics reports. You’ll be able to:
- Create heatmaps for one page or multiple pages on your site
- Create heatmaps for visitors coming from a specific source or campaign
- Create heatmaps for returning visitors, new visitors, or all types of visitors
- Create heatmaps for visitors using a specific device to come to your site
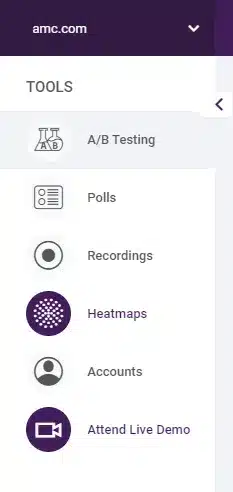
Not only that but you also get access to:
- A/B Testing tool
- Polls
- Video recordings (session replays)
Okay, let’s jump right into how can you create your free heat map now!
How do I create a website heat map?
1. Log in to FigPii.
2. The FigPii code will appear at the bottom section of the dashboard3. Click on “copy code”4. Paste the FigPii Tracking Code into the <head> section of your website.

3. Click on “copy code”

4. Paste the FigPii Tracking Code into the <head> section of your website.
FigPii integrates with major CMS and e-commerce websites, check our full list of integrations right here.
5. Check your FigPii dashboard to verify the installation. When the tracking code is installed on your site, the tracking indicator will show you that the code is active.
Once you have added the FigPii Tracking Code to your site, you will need to wait for about an hour to check if it is installed correctly. This usually happens the moment your site is loaded with the FigPii tracking code installed in. But there can be a delay for up to an hour before it shows as “Active”.
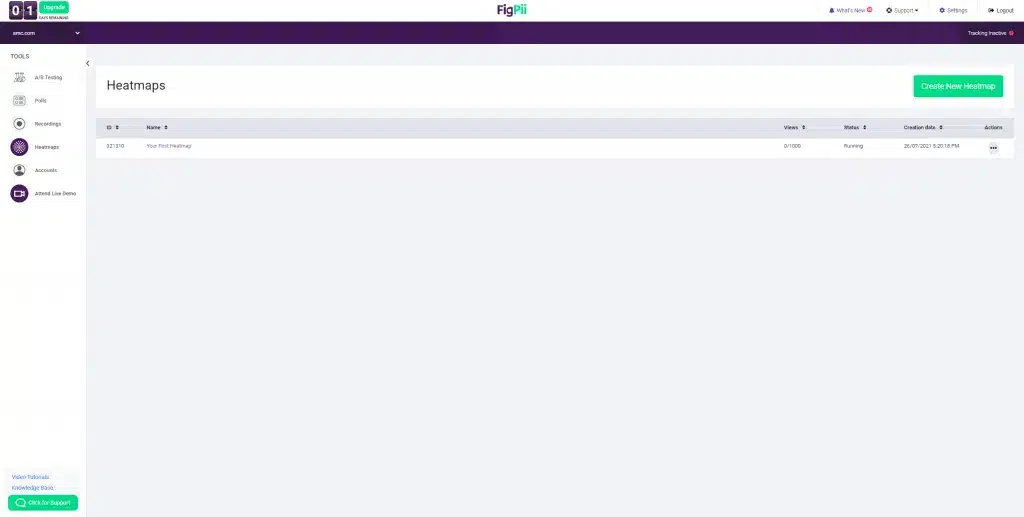
6. log in to FIgPii’s dashboard, and go over the heatmap section from the side menu.
7. Press on create a heat map
8. Name your heat map
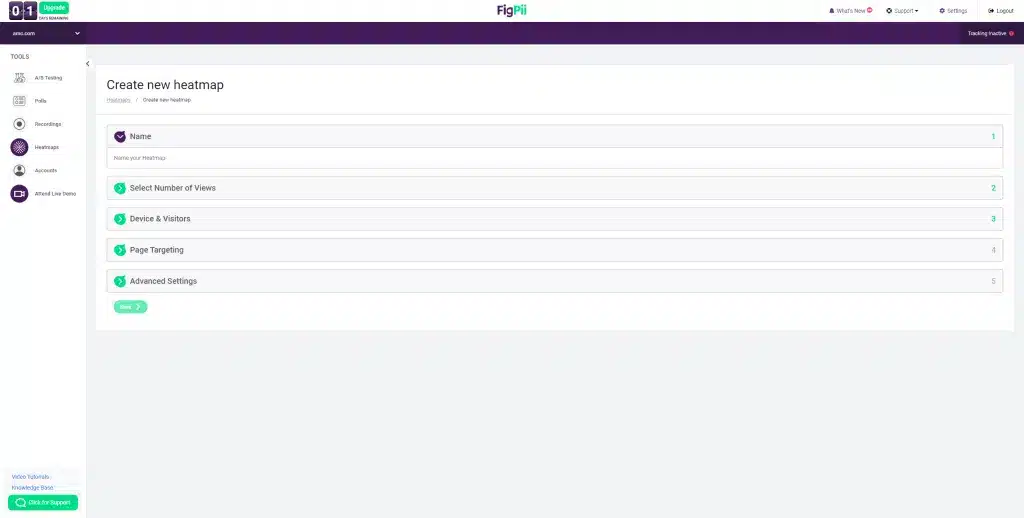
9. Choose the number of recordings that you want
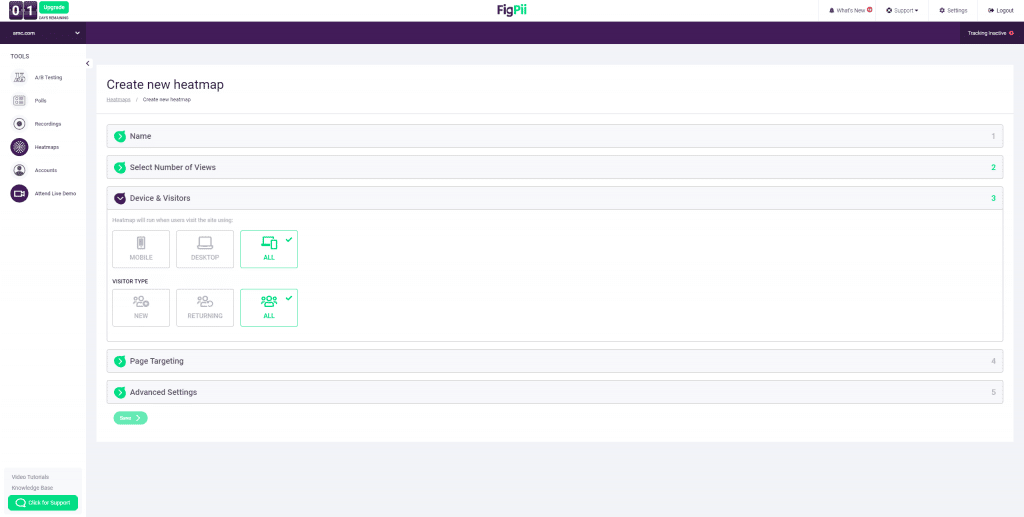
10. Choose which platform you would like to record, you can choose mobile or desktop.
You’re also able to track new visitors or returning users.
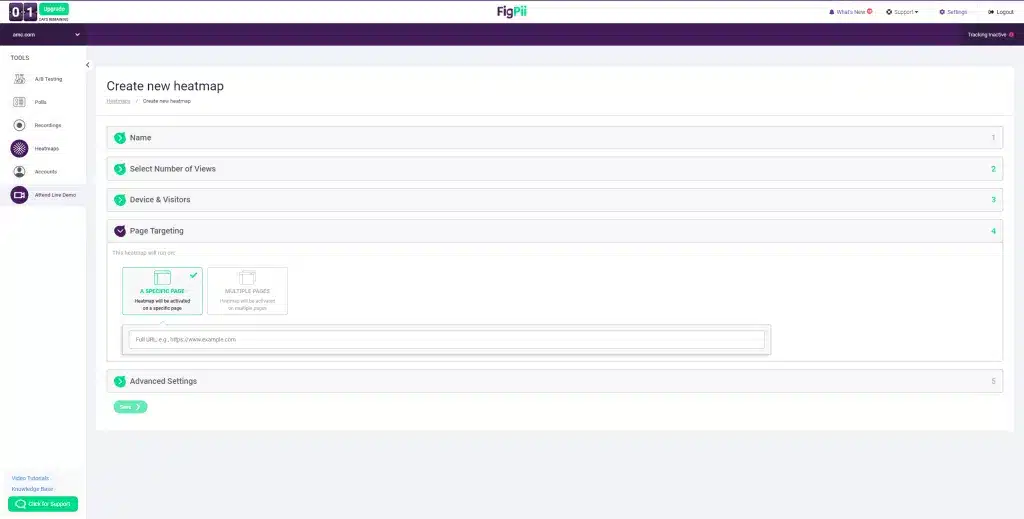
11. Choose which page or pages you would like to track with your heatmap.
12. Configure your map with advanced options that help you create more accurate data
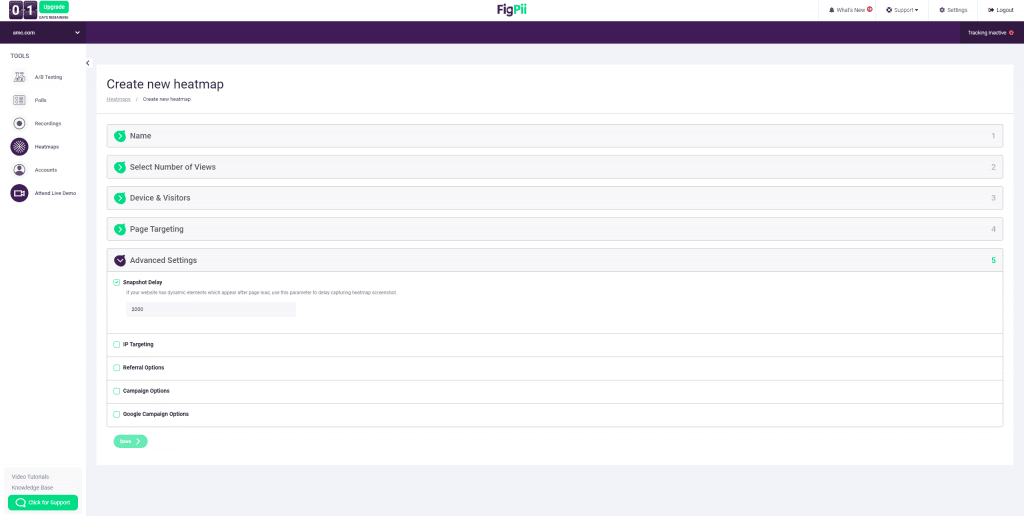
You’re done! Now you’ll be able to track your users like you never could before!
Why do you need a heat map analytics tool?
Heatmap analytics helps you to see where your visitors are most engaged on your website.
You will be able to see how your website design is working, and what parts of the site are causing visitors to leave.
Heatmap analytics also helps you understand where people navigate through a particular page or section of your website.
You can use this information for marketing purposes, such as determining which part of the homepage should have more content.
If one section has lower engagement than another area that means that viewers may not know about all the features available there; so they might need more information or links from other sections of their sites to draw them over there.”
You can quickly visualize user behavior on a site.
You can see where the most traffic is coming from on your website and why people are clicking there, such as Google Ads or social media sites like Facebook.
Conclusion
Google has unfortunately stopped the Google Analytics heat map in 2017
But don’t worry, FigPii is offering a free alternative for people who are still looking for one.
We’ve created an awesome Google analytics heat map alternative with all the features that Google’s old tool had and now plus more detailed reports which are free to use up until 14 days of sign-up.
You can quickly visualize user behavior on a site.
You can see where the most traffic is coming from on your website and why people are clicking there, such as Google Ads or social media sites like Facebook.”
In this blog, we’ve detailed for you how to create a heatmap so you can be up and running in no time.
And we’ve collected for you the reasons that will make you want a heatmap in case you were just searching for the topic or want to present this to your supervisors.
And we’d love to offer you a 14-days free trial for FigPii to get to know your heat maps well, and start taking actions based on solid data!
Click here and start your free trial, and if you have any questions just reach out to us!