

Imagine you’re a marketer testing two different email subject lines to see which one gets more opens. It’s like choosing between two doors—one leads to a room full of engaged customers, and the other, well, let’s just say it’s not where you want to be.
Making the wrong choice could mean missing out on valuable conversions or, worse, wasting resources on a strategy that doesn’t work.
This is where Type 1 and Type 2 errors come into play. They’re the pitfalls that can trip you up in your A/B testing journey, leading you to the wrong door. In statistical terms, these errors are known as false positives and false negatives.
In this article, you’ll learn what these errors are, why they can make or break your A/B testing strategy, and how to minimize their occurrences.
The Anatomy of Errors in A/B Testing
Errors in A/B testing are an inherent part of the process, mainly due to the statistical nature of these tests. When conducting an A/B test, one is essentially drawing conclusions based on a sample of data, which may not represent the entire customer base. This inherent limitation in sampling makes the occurrence of Type 1 and Type 2 errors unavoidable.
Understanding Null Hypotheses
Before we get into what type 1 and type 2 errors are, it’s important to understand what the null hypothesis is.
The null hypothesis, symbolized as H0, is a fundamental concept in statistical testing. It serves as the default or initial assumption that there is no effect or difference between the groups being compared.
In simpler terms, H0 posits that any observed differences in performances of variations are due to random chance rather than an underlying cause or effect.
In A/B testing, the null hypothesis often states that there is no significant difference between the control group (A) and the variant group (B) concerning the metric under investigation, such as conversion rate or user engagement. The objective is often to reject the null hypothesis in favor of the alternative hypothesis based on statistical significance.
Relationship between the Null Hypothesis and Type 1 and Type 2 Errors
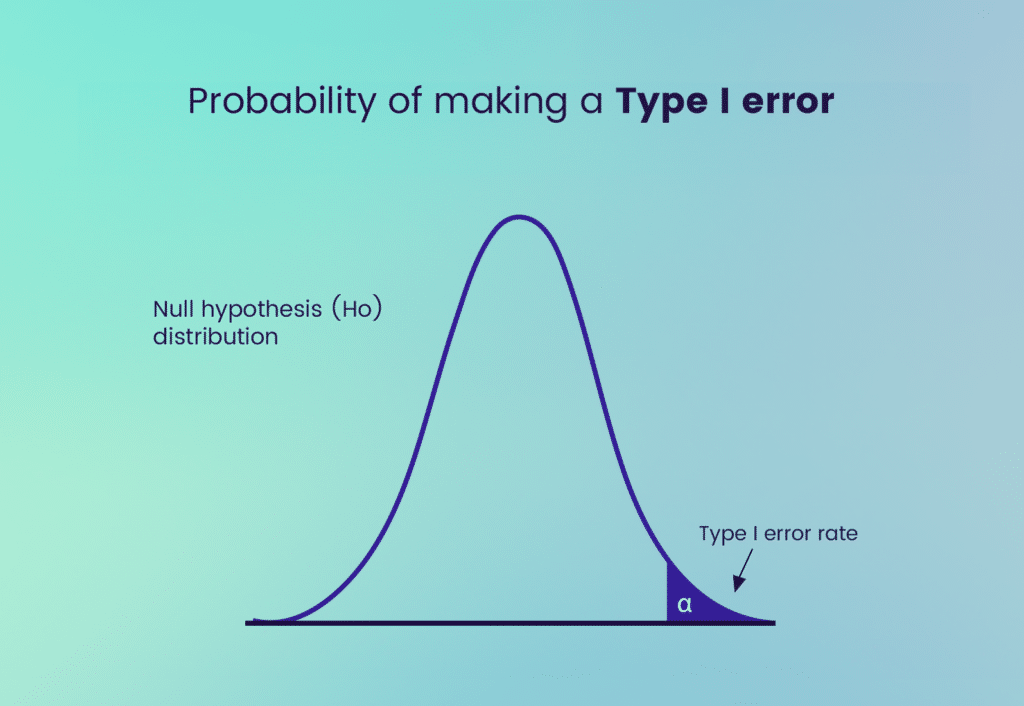
The null hypothesis, H0, is intrinsically connected to Type 1 and Type 2 errors. A Type 1 error occurs when H0 is incorrectly rejected, leading to the false conclusion that there is a significant difference between the groups when, in fact, there is none.
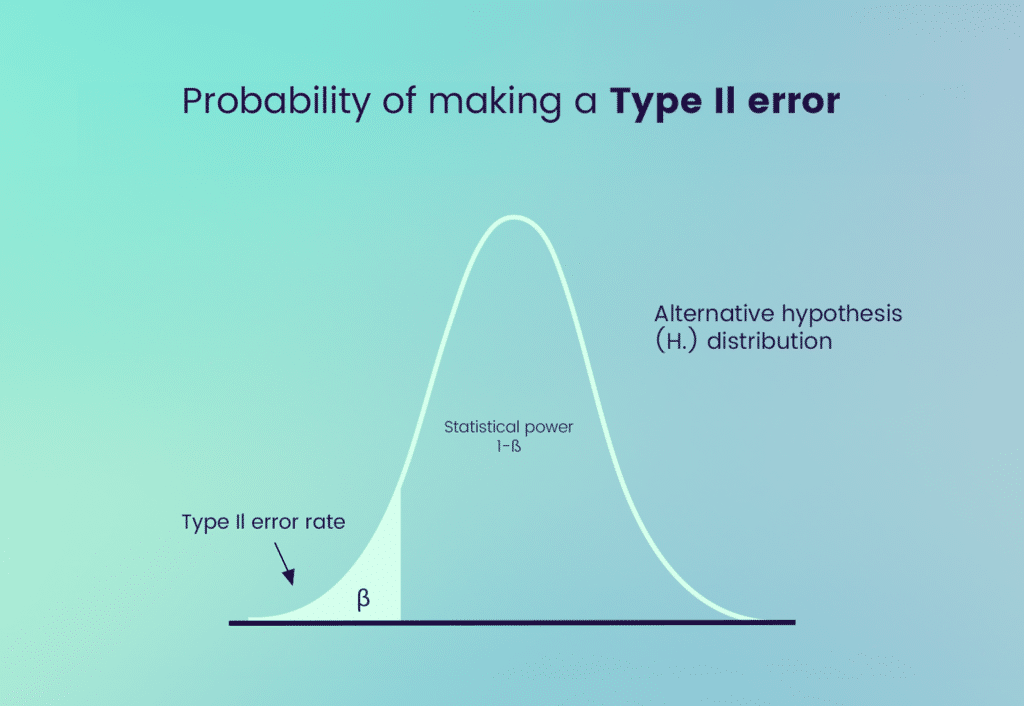
On the other hand, a Type 2 error arises when H0 is incorrectly retained, thereby failing to identify a real difference or effect. Both types of errors compromise the integrity of the hypothesis-testing process and can result in flawed business decisions.
Deep Dive into Type 1 Errors
As stated earlier, a Type 1 error, often denoted by the symbol α, occurs when the null hypothesis is incorrectly rejected. The level of α is often set prior to the test and represents the probability of committing a Type 1 error.
Scenario for Type 1 Error
You run an A/B test comparing the two subject lines. At the end of the test, the data suggests that the “New Subject” has a significantly higher open rate. Thrilled, you decide to roll it out to your entire email list.
Type 1 Error: In reality, the “New Subject” line doesn’t have a higher open rate; the test results were a fluke. You’ve rejected the true null hypothesis (“New Subject” is not better than “Old Subject”).
Causes of Type 1 Errors (False Positives)
- Expecting a larger effect than what is true can lead to overinterpreting normal variations as significant differences.
- Conducting multiple comparisons without adjusting for significance increases the likelihood of incorrectly rejecting the null hypothesis at least once.
- Searching through data for patterns without a specific hypothesis can result in identifying false positives purely by chance.
- Choosing a higher alpha level (e.g., 0.10 instead of 0.05) increases the probability of rejecting the null hypothesis erroneously.
- Lack of proper randomization or control groups can introduce bias, leading to incorrect conclusions.
Consequences of Committing a Type 1 Error
- Implementing a change based on a false positive can lead to a waste of time, money, and manpower on a strategy that’s not effective.
- While focusing on a strategy that doesn’t work, you might miss the chance to implement one that does, leading to lost revenue.
- If the change negatively impacts user experience, it can harm your brand’s reputation and customer loyalty.
- A Type 1 error can cast doubt on the reliability of your A/B testing process, making stakeholders less likely to trust future test results.
- Implementing ineffective changes can put you at a disadvantage, especially when your competitors make more data-driven, effective decisions.
How to Minimize Type 1 Errors
- Adjust the Significance Level: One common approach is to set a lower α level, such as 0.01 instead of the conventional 0.05, to reduce the chances of incorrectly rejecting the null hypothesis.
- Increase Sample Size: A larger sample size can provide more accurate results, reducing the likelihood of a Type 1 error.
- Sequential Testing: This involves periodically checking the data and stopping the test once sufficient evidence has been gathered, reducing the chances of a Type 1 error.
- Peer Review: Before making any significant changes based on the test results, having the data and methodology peer-reviewed can serve as an additional safeguard against Type 1 errors.
Type 2 Errors
A Type 2 error, commonly represented by the symbol β, occurs when the null hypothesis, H0, is incorrectly accepted or failed to be rejected. The probability of committing a Type 2 error is β, and it is inversely related to the test’s power, which is 1−β.
Scenario for Type 2 Error
Again, you run an A/B test comparing the two subject lines. This time, the A/B Test results suggest no significant difference between the “New Subject” and “Old Subject” lines. So, you stick with the “Old Subject” line.
Type 2 Error: In reality, the “New Subject” line does have a higher open rate, but the test failed to detect this difference. You’ve failed to reject a false null hypothesis (“New Subject” is not better than “Old Subject”).
Causes of Type 2 Errors (False Negatives)
- Too small a sample may not have the power to detect an actual effect, leading to a failure to reject the null hypothesis when it is false.
- Besides sample size, other factors like effect size and variability can contribute to low power, increasing the risk of a Type 2 error.
- Setting the significance level too low can make it too difficult to detect a real effect, which can result in a Type 2 error.
- High variability within test groups can obscure true differences between the control and experimental groups.
- Errors in how data is collected, such as timing issues or non-representative samples, can lead to a failure to detect real differences.
Consequences of Committing a Type 1 Error
- Failing to recognize a genuinely better strategy can result in missed opportunities for increased revenue, customer engagement, or other key metrics.
- Sticking with an outdated or less effective strategy can lead to stagnation and inhibit growth.
- While you continue to invest in a less effective strategy, you’re not allocating resources to more impactful initiatives.
- Market Lag: Failing to implement beneficial changes can result in falling behind, especially if competitors are more agile in testing and implementation.
How to minimize type 2 errors
While we’ve talked about how to minimize the chances of Type 1 errors, it’s also crucial to address Type II error risk.
- Extend the Testing Duration: Running the test for a longer period can capture more variations and seasonality, reducing the chances of a Type 2 error.
- Adjust the Significance Level: While lowering the α level reduces the risk of a Type 1 error, it increases the risk of a Type 2 error. Therefore, a balanced approach to setting α is essential.
- Use a One-Tailed Test: If applicable, using a one-tailed test can increase the test’s power, thereby reducing the likelihood of a Type 2 error.
- Pre-Test Analysis: Conducting a power analysis before the test can help you determine the required sample size to minimize β.
Frequently Ask Questions
How do Type 1 and Type 2 errors differ from each other?
Type 1 and Type 2 errors are like two sides of the same coin, but they’re different in crucial ways. A Type 1 error, or false positive, happens when you think you’ve found a winner in your A/B test, but it’s a false alarm. You ditch your old strategy for a new one that’s not better.
A Type 2 error, or false negative, is the opposite. It’s like not recognizing a winning lottery ticket when you see one. You stick with your old strategy when the new one could have been a game-changer.
What is the significance level, and how does it relate to Type 1 errors?
The significance level, often denoted by α, is like your safety net in A/B testing. It’s a number between 0 and 1 that you set before running the test, and it helps you decide how much risk you’re willing to take with a Type 1 error.
The lower you set α, the less likely you are to make a Type 1 error. However, setting it too low might make it harder to detect real improvements.
What is statistical power, and how does it relate to Type 2 errors?
Statistical power is your test’s ability to spot a real difference when there is one. In A/B testing, it’s represented as 1−β, where β is the probability of making a Type 2 error.
Higher statistical power means you’re less likely to make a Type 2 error, so you won’t miss out on implementing a strategy that could be better.