

Think of marketing as a game of chess, where every move must be strategic and well-informed.
To stay ahead of the game, marketers must continually analyze their website’s performance, just like a chess player needs to analyze their opponent’s every move.
This is where web analytics tools come in – they provide valuable insights into your website’s traffic, performance, and user behavior, which can help you optimize your marketing strategies.
Hotjar has long been a popular choice for web analytics, but in recent times, plenty of other options are now available. In this article, we’ll explore the eight best Hotjar alternatives that can help take your web analytics game to the next level.
But before we discuss the alternatives, let’s briefly discuss Hotjar as a web analytics tool.
What is Hotjar?
HotJar is a web and behavioral analytics tool that provides insights into user behavior through features such as heatmaps, session recordings, conversion funnels, customer feedback polls, and more.
It is known for its usability and effectiveness in helping businesses optimize their websites and understand how users interact with their content.
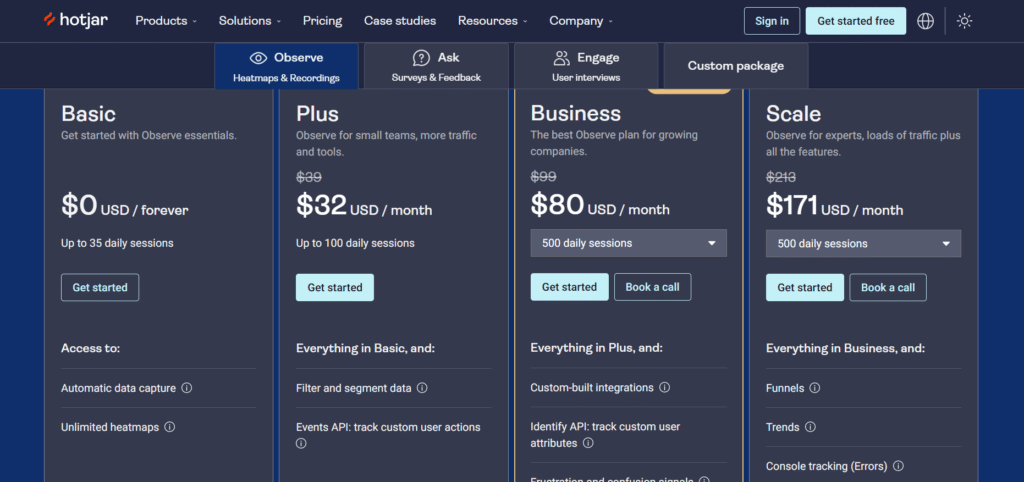
Hotjar Pricing
Key Features Of Hotjar
- Heatmaps: Provides visual representations of how users interact with different parts of a website.
- Session Recordings: You can watch recordings of actual user sessions to understand their actions and behavior on your site
- Conversion Funnels: Helps track user journeys and identify conversion bottlenecks.
- Feedback Polls: Enables businesses to collect user feedback in a structured manner.
Pros
- User-friendly interface: HotJar is known for its easy-to-use interface, making it accessible to non-technical users.
- Wide range of features: HotJar offers a variety of features that can help businesses optimize their websites and improve user experience.
- Integrations with popular website platforms: HotJar integrates with popular websites such as WordPress and Shopify, making it convenient for many users.
Limitations and Why Hotjar Alternatives are Important.
- Potential data accuracy issues: HotJar relies on tracking codes and cookies to collect data, which may not always capture user behavior accurately, especially if users turn off their cookies.
- Storage limitations for session recordings: HotJar has a storage limit for session recordings, which may require users to upgrade to a higher pricing tier for more storage.
- User privacy concerns: HotJar collects user data for analysis, which may raise concerns about privacy and compliance.
- Creating and Tracking Events in Hotjar requires that you are on a paid plan. This feature also requires you to write code and use their Event API, which can be challenging if you have no technical background.
Criteria for Evaluating A Web Analytics Platform
When selecting a web analytics tool, several important factors must be considered, including
-
User Interface and Ease of Setup
A user-friendly interface lets you quickly and easily access the needed metrics. Most of these tools also require that you have varying levels of technical knowledge when setting them up. Ensure you choose tools that you can set up or can afford to hire a developer to help you set up.
-
Features
A tool that provides a wide range of data points, including advanced features like heat mapping, a/b testing, surveys and feedback tool, session recording, and funnel analysis.
-
Pricing
Consider your budget and needs when selecting a tool that fits your financial constraints.
-
Integrations
Look for a tool that integrates seamlessly with your existing marketing and website management tools.
-
Reporting
The tool should have a robust reporting system that provides relevant and actionable insights. The reports should be customizable and easy to understand, allowing you to identify areas that require immediate attention.
-
Customization
Look for a tool that integrates seamlessly with your existing marketing and website management tools.
-
Customer support
Consider the availability of robust support systems, including documentation, a knowledge base, and direct support from the company’s customer support team.
Hotjar Alternatives To Conider
-
Figpii
Overview of Figpii
FigPii is a web analytics tool and A/B testing platform designed to help optimize your site user experience and conversion rate. It is an all-in-one platform that offers a range of features, including:
- A/B testing,
- Session replays,
- Polls,
- Heat mapping.
As a web analytics tool, FigPii allows you to track and analyze key performance metrics such as traffic sources, page views, and conversion rates. FigPii’s A/B testing feature allows you to compare two or more versions of a page or page on your website to see which performs better and can boost your conversion rate.
As an A/B testing tool, you can easily set up and run tests, set as many A/B testing goals as you want, monitor results in real time, and make changes to your site based on the data from the analysis of the A/B test results.
Key Features of Figpii
- Heatmaps: FigPii shows visitors’ clicks, movement, and scroll depth when interacting with your website. Heatmaps help you understand which parts of your website are most engaging and which may need improvement. FigPii also segregates your visitors’ interactions based on device type.
- Session Recording: This feature lets you record and watch visitor sessions as they interact with your website. For simplicity and ease of data analysis, user sessions can also be separated based on device type and visitor type, whether new or returning visitors.
- A/B Testing: FigPii’s A/B testing feature allows you to run A/B tests on single or multiple pages of your website. These tests can target visitors from specific traffic sources and device types. Also, the A/B tests on FigPii allow you to create unlimited site variations when setting up the tests.
- Polls & Surveys: FigPii’s Polls & Surveys feature allows you to collect customer feedback. You can create custom surveys and polls asking visitors about their website experience. FigPii polls and surveys support different answer formats, including long texts, single-line text, and multiple answers.
- Machine Learning: Using machine learning, FigPii analyzes the impact of the changes on your site on user behavior and makes suggestions that will increase your chances of improving your site’s conversion rate.
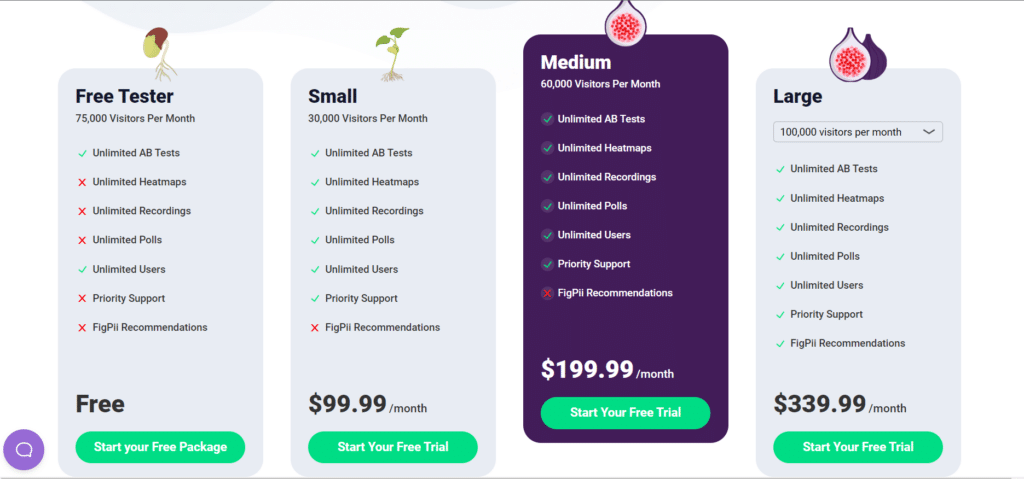
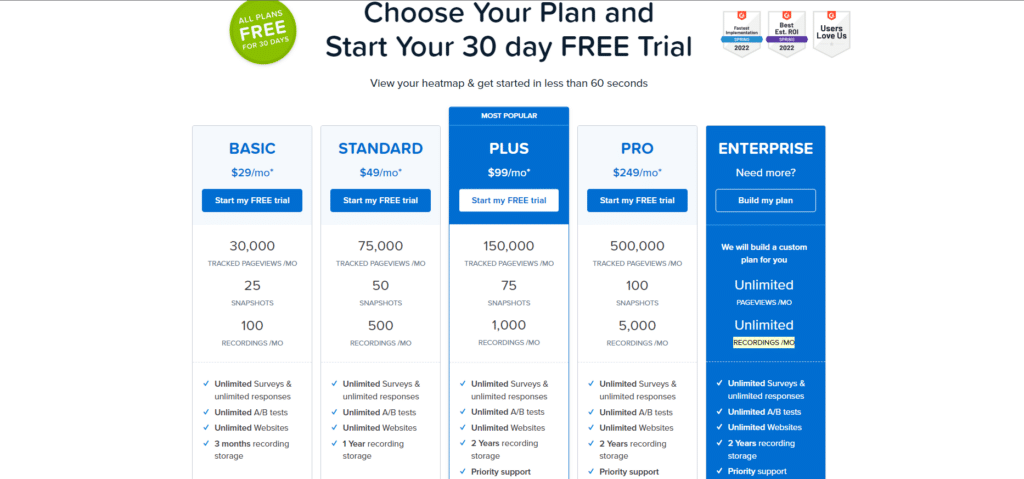
FigPii Pricing
It takes less than 60 seconds to opt into any of the available FigPii plans. The plans are broken down, and their prices differ depending on your analytics and A/B testing needs.
What makes FigPii a better Hotjar Alternative?
Let’s discuss other factors that make FigPii a better Hotjar alternative.
- A/B Testing: Unlike Hotjar, a complementary tool to other A/B testing software, FigPii has its own A/B testing tool that allows you to create and test different variations of your website to see which performs better at improving your conversion or achieving any testing goal you set.
- Alternative to Google Optimize: FigPii is an excellent optimization tool alternative to Google Optimize since it offers the same website experimentation capabilities as Google Optimize.
- Machine Learning: FigPii uses machine learning to understand and analyze how site visitors interact with your website elements.
- Time-Saving: Regarding session recording and replays, FigPii helps you save time by showing you only the most important sessions.
-
Crazy Egg
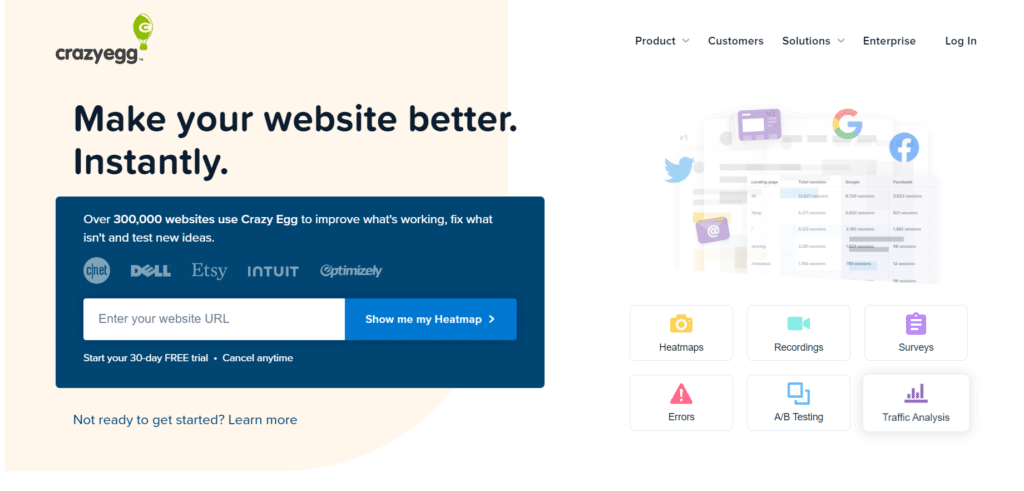
Overview of Crazy Egg
Crazy Egg is another website analytics and optimization tool providing valuable user behavior and performance insights.
With Crazy Egg, you can create heatmaps, track user clicks and scrolling, and monitor user sessions to understand user behavior and preferences better.
This tool is popular among UX Designers and Digital marketers because of its versatility. Digital marketers use it to track user behavior and conversions, while UX designers use it to optimize the user interface and create a seamless user experience.
Key Features of Crazy Egg
- Heatmaps: Crazy Egg’s heatmaps provide a visual representation of how users interact with your website, showing which areas of the page are getting the most clicks, attention, and engagement.
- Recordings: With Crazy Egg’s recording feature, you can watch user sessions on your website, replaying the movements and clicks of individual users to understand their behavior better.
- A/B Testing: Crazy Egg’s A/B testing feature allows you to test different website versions to see which performs best regarding user engagement, conversions, and other key metrics.
- Traffic Analysis: It helps you track and analyze website traffic, including the source, location, and behavior of your visitors.
- Errors Tracking: Crazy Egg allows you to capture and organize detailed information about Javascript-based errors automatically. It also provides a clear detail of the errors on your website.
- Surveys: To collect feedback from your website visitors, gaining valuable insights into their needs, preferences, and behavior.
- Confetti: It provides a color-coded view of your website, showing exactly which areas get the most clicks from which audience segments.
Crazy Egg Pricing
Here’s what the different plans for Crazy Eggs look like; the good thing is that all the plans are free for 30 Days.
-
Mouseflow
Overview of Mouseflow
Mouseflow is a website behavior analytics tool that tracks user behavior using heatmaps and session replays, including mouse movements, clicks, and scroll patterns. It provides insights into users’ actions on your site.
Mouseflow is particularly useful for tracking eCommerce sites because it allows you to see how visitors engage with your website and where they face challenges, providing you with actionable insights that can help you improve your website and boost your conversion rate.
Key Features of Mouseflow
- Heatmaps: Mouseflow shows where users click, scroll, and move their mouse on your website. This information can help you identify areas that are getting the most attention from users and may be overlooked.
- Session Replay: With Mouseflow’s session replay feature, you can watch recordings of individual user sessions on your website. This tool can help you identify pain points in the user experience and make data-driven decisions to improve website performance.
- Funnel Analysis: Mouseflow allows you to create funnels to track user behavior and identify where users drop off in the conversion process.
- Form Analytics: It provides insights into how users interact with forms on your website.
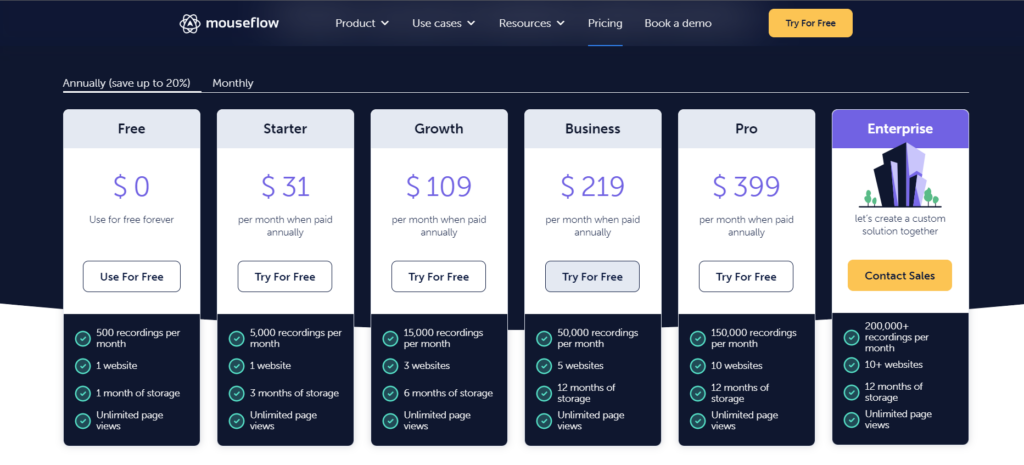
Mouseflow Pricing
Understanding the different pricing options offered by Mouseflow can help you determine which plan is right for your business and budget.
-
Lucky Orange
Overview of Lucky Orange
Lucky Orange is a versatile customer experience and web analytics software that helps optimize websites and mobile apps. Its features include heat maps, click maps, scroll maps, session recordings, conversion funnels, form analytics, and on-site surveys.
With Lucky Orange’s advanced functionalities, you can analyze the entire user journey from landing to conversion. This comprehensive approach enables you to optimize your website’s performance, resulting in higher conversion rates and enhanced user experience.
Lucky Orange’s web analytics software provides a detailed overview of your website’s traffic and user interactions with page elements, page sessions, bounce, and exit rate, which helps you make informed decisions on improving website performance and user engagement.
Key Features of Lucky Orange
- Heat maps: A visual representation of where users click and scroll on your website.
- Session recordings: A video of users’ interactions with your website, including mouse movements and clicks.
- Conversion funnels: A report of users’ steps to complete a goal, such as making a purchase or signing up for a newsletter.
- Form analytics: A report of user behavior on forms, including time spent on each field and drop-off rates.
- On-site surveys: A tool for collecting user feedback while they are on your website.
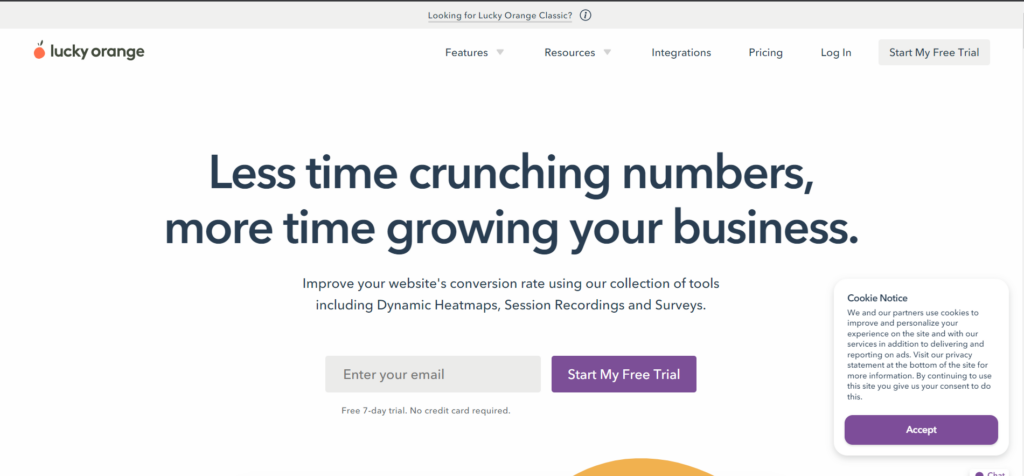
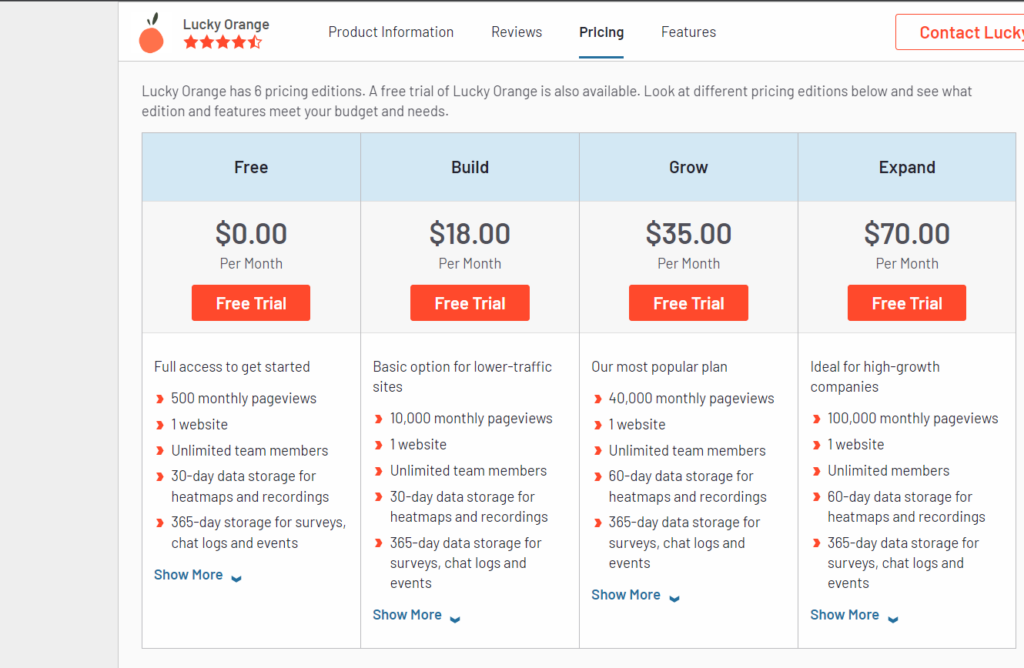
Lucky Orange Pricing
Lucky Orange has different pricing plans that cater to a range of customers, depending on their needs.
-
MixPanel
Overview of Mixpanel’s user interface and features
Mixpanel is another alternative to Hotjar that allows businesses to track and analyze user behavior across web and mobile platforms. It provides tools for creating custom events, funnels, and user segments, which can be used to analyze user behavior and identify areas for improvement.
Mixpanel also offers engagement tools such as push notifications, in-app messaging, and email campaigns to help businesses re-engage users and drive conversions.
While Mixpanel does not offer native A/B testing functionality, it does integrate with other A/B testing tools such as Optimizely and VWO. These integrations allow businesses to use Mixpanel’s user behavior data to inform their A/B tests and measure the impact of their optimizations.
Key Features of Mix Panel
- Standard and Custom Event Tracking: Mixpanel allows you to track and analyze specific user actions on your website or app, such as clicks, purchases, and signups.
- Flows Report: It provides a clear and detailed picture of how users move through different stages of different activities on your site. Flows can help you understand users’ actions before and after they make other decisions on your site.
- Funnels Report: Mixpanel’s funnel analysis feature lets you track how users move through different conversion stages, such as adding an item to a cart and completing a purchase. This can help you identify where users are dropping off and make changes to improve conversion rates.
- User Segmentation: With Mixpanel, you can segment your users based on specific criteria such as behavior, demographics, or location. This can help you better understand your website’s hidden patterns in user behavior.
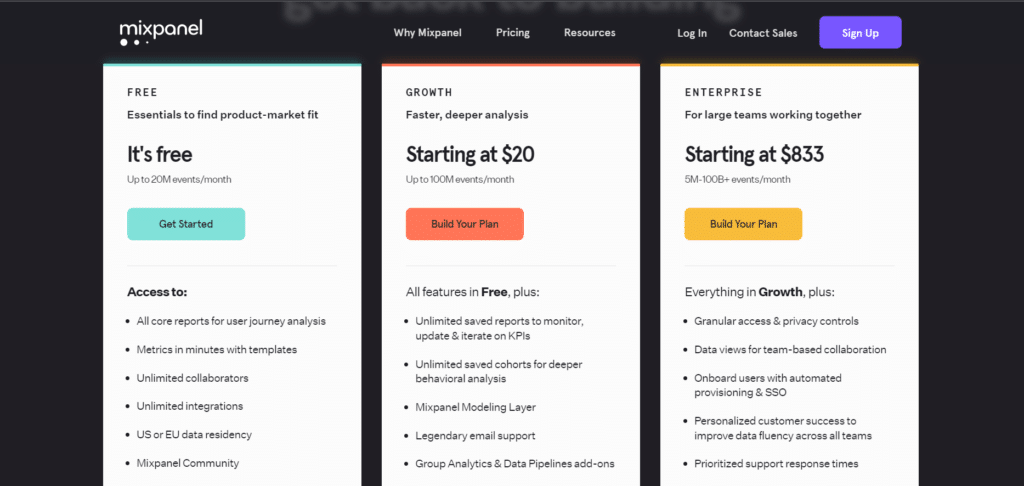
Mixpanel Pricing
Mixpanel has three major customized pricing plans based on your requirements. The free plan doesn’t allow you to have add-ons; however, with the Growth and Enterprise plans, you can add additional features, which would cost you extra bucks.
-
Kissmetrics
Overview of Kissmetrics
Kissmetrics is a web and mobile analytics platform that provides businesses with insights into user behavior and engagement. It enables you to track user activity and analyze data to get actionable insights that will help increase conversions and optimize user engagement.
Kissmetrics is designed to track user behavior across multiple devices and channels, providing businesses with a comprehensive view of the customer journey. Kissmetrics caters to
Key Features of Kissmetrics
- Behavioral Analytics: Kissmetrics provides businesses with insights into user behavior and engagement. It enables businesses to track user activity and analyze data to make data-driven decisions, increase conversions, and optimize user engagement.
- Funnel Analysis: With Kissmetrics, businesses can track and analyze user behavior across multiple steps in a funnel. This can help businesses identify areas of friction or drop-off and make data-driven decisions to optimize the user experience and increase conversions.
- Cohort Analysis: Kissmetrics enables businesses to analyze user behavior over time, grouping users based on specific criteria such as the date of their first visit or signup. This can help businesses understand how user behavior changes and identify trends that can inform business decisions.
- A/B Testing: Kissmetrics provides businesses with a built-in A/B testing tool that uses on their Javascript Library. I also support the integration of other A/B testing tools like Optimizely, VWO, etc. Using a third-party A/B testing tool, you can analyze your reports using the Kissmetrics A/B Test Report feature.
- Campaign Creation and Tracking: Kissmetrics allows businesses to create email campaigns and track performance. This can help businesses understand the effectiveness of their marketing efforts and make data-driven decisions to optimize their campaigns.
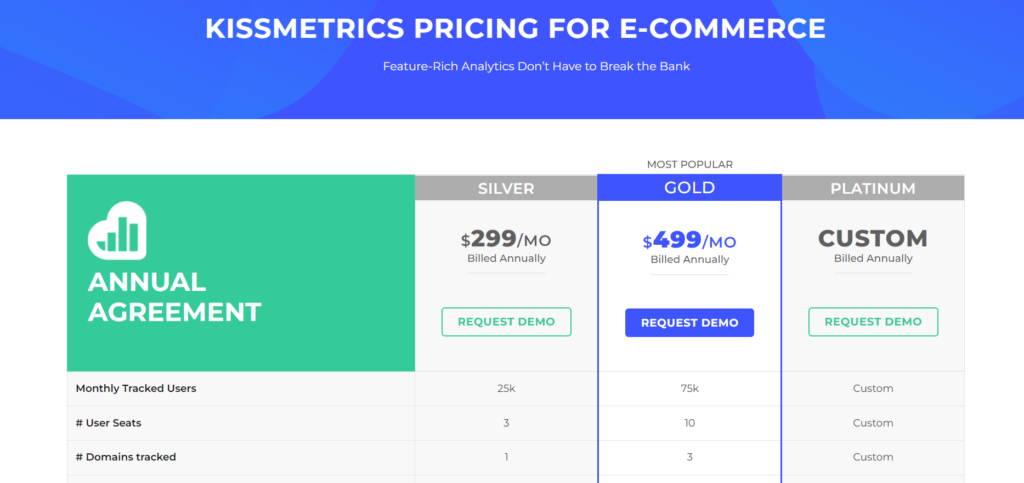
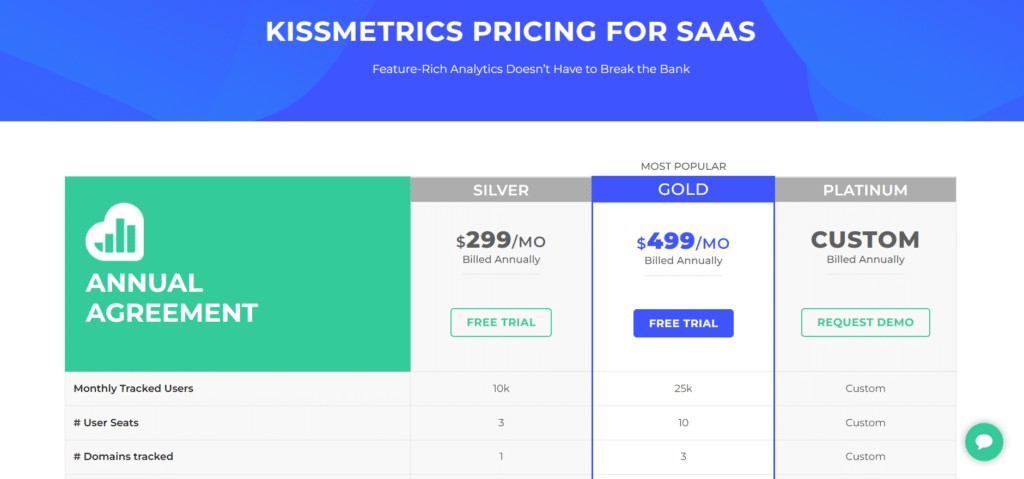
Kissmetrics Pricing
Kissmetrics understands that folks across different industries will be interested in their products; therefore, they created their prices for the Ecommerce and the SAAS industries separately.
Ecommerce Pricing
SaaS Pricing
-
Heap Analytics
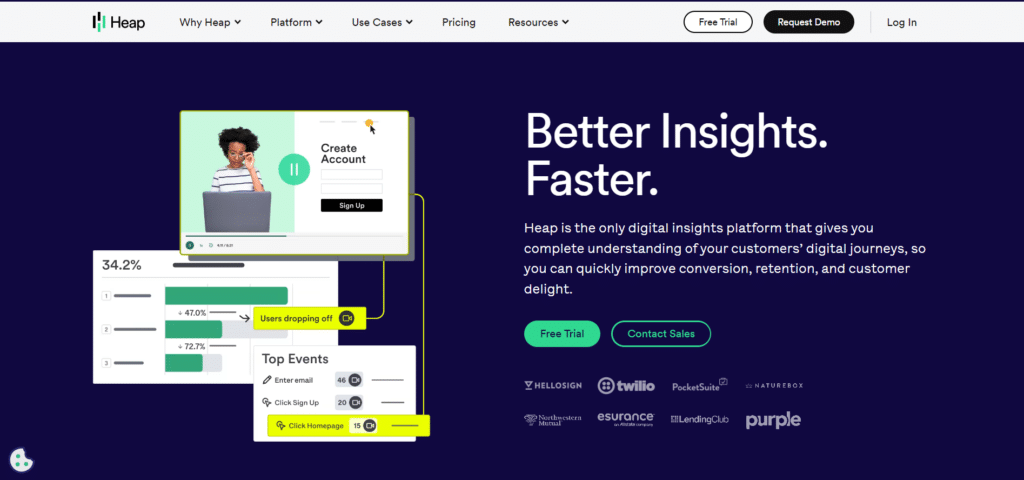
Overview of Heap Analytics
Heap Analytics is a web analytics and digital insight platform with quantitative and qualitative analytics features that you can use to gather data from all sections of your website.
It presents it in an understandable format using line graphs and funnels. Its primary emphasis is on customer engagement and activity, providing valuable insights into the customer journey and identifying areas that require improvement.
With Heap, brands can obtain actionable insights for enhancing customer experience and optimizing business operations.
Key Features of Heap Analytics
- Automatic data capture: Heap Analytics automatically captures all user interactions on a website or mobile app, eliminating the need for manual event tracking. This means that users can obtain comprehensive data without spending time configuring tracking codes.
- Retroactive Analytics: Heap Analytics allows users to analyze data retroactively, meaning that they can analyze data from past events that were not tracked in real-time.
- Visual Event Tracking: Heap Analytics provides a visual interface for event tracking, making it easy to track user interactions without writing code.
- Behavioral Cohorts: Heap Analytics allows users to create behavioral cohorts, which are users with similar behaviors or characteristics. This feature can analyze how user segments interact with a website or app and identify patterns and trends.
- Data governance: Heap Analytics provides robust data governance features that ensure data is accurate, secure, and compliant with privacy regulations.
Heap Analytics Pricing
Unlike the other analytics tools discussed, Heap Analytics is the only one without specific prices for their different pricing plans. You would need to contact their sales team to find out how much each plan costs.
-
Woopra
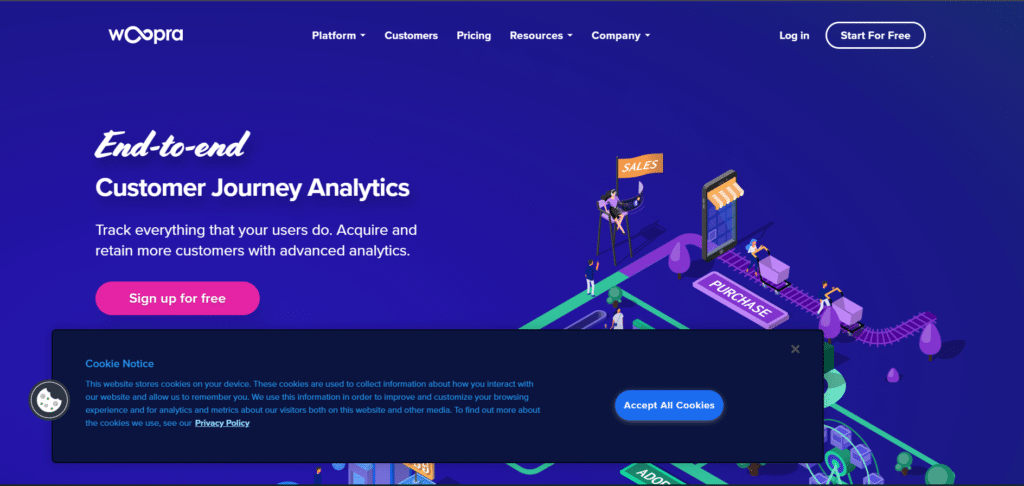
Overview of Woopra
Woopra is a customer journey and product analytics platform that helps businesses understand how customers interact with their website, mobile app, and email campaigns. With Woopra, you can track all sorts of user behaviors, like which pages they visit, what they click on, and even how long they spend on each page.
Key Features of Woopra
- Customer Journey Tracking: Woopra provides businesses with a comprehensive view of the customer journey across multiple channels, enabling businesses to track user behavior and engagement across web, mobile, and email.
- Real-Time Analytics: Woopra allows businesses to track user activity in real time, providing businesses with up-to-date insights into user behavior and engagement.
- Campaign Tracking: With campaign tracking, businesses can assign a unique tracking code to each campaign they launch. This code is embedded in the links that are shared across different channels. When a user clicks on one of these links and visits the business’s website or app, Woopra can track that user’s behavior and attribute it to the specific campaign they clicked on.
- Segments: Woopra enables you to segment users based on specific behaviors, enabling businesses to target specific user groups with personalized messaging and offers.
- User Retention Analysis Reports: Woopra allows you to analyze user retention, providing insights into how their behavior changes over time and identifying trends that can inform your business decisions.
Woopra Pricing
There are three different pricing plans available on Woopra.
Over To You
Each tool offers unique features and capabilities, so you can select the right tool that aligns with your needs and goals. From affordability to advanced features, flexible pricing options, and comprehensive analysis, these alternatives outperform Hotjar in one way or another.
Additionally, most of these tools also support the integration of Google Analytics, which can provide additional insights into your site performance.
It is now left to you to decide what features are most important to your business needs and if the tools with these features are within your budget.