

Hotjar and FullStory are two of the most popular conversion optimization and user experience analytics tools in the market today. Both have their strengths and weaknesses, with Hotjar being more beginner-friendly and FullStory having more advanced features.
Many businesses will struggle to decide which is right for them, so we’ve created this detailed comparison to help you make an informed decision.
Hotjar vs. FullStory: What are they?
Hotjar:
Hotjar is a user experience and web analytics tool that tracks website visitors’ behavior and provides you with actionable feedback on improving your website’s design, navigation, content, and marketing campaigns.
It provides actionable insights on where your users click, tap, move, scroll, how far they scroll, and what they completely ignore. Watching videos of users interacting with your websites allows you to identify improvement areas.
A step further, Hotjar enables you to ask questions directly to your visitors and focus only on your most valuable user demographics.
Hotjar paints a holistic picture of user behavior to eliminate the guesswork on why users left your website or didn’t interact with a particular element.
Some of Hotjar’s significant features include:
- Heatmaps to visualize user behavior
- Recordings to see precisely what your users see
- Feedback to discover how your users feel
- On-site surveys to directly hear from site visitors and users
FullStory:
FullStory offers raw data on visitors’ experiences, with visuals that reveal what frustrated the users. This helps design and development teams track down bugs and issues.
It’s also a video replay service that lets you see what visitors do on your site. You can view recordings as they happen or dig into them later to analyze user behavior. FullStory records everything on your website, so you can see what people do and why they do it.
It offers insights into the context of the visitor’s visit, including what was on their screen, what they clicked on, and where they were heading. It’s like having a camera pointing directly at your website.
Some of FullStory’s major features include
- Automatic alerts for frustration signals
- Session replay
- Heatmaps
- Funnels and conversions
- Journey mapping
- Dashboards
- User segments
Hotjar Vs. FullStory: Detailed Comparison
When it comes to heatmaps, there are two main software options that businesses and marketers use: Hotjar and FullStory. Both can be used to make data-driven decisions about your website or app, but which one should you use? Let’s look at each feature and see if we can find out which is better.
1. Heatmaps
Hotjar:
Heatmaps gather information as soon as you add the Hotjar tracking code to your website. Only pages with the Hotjar code set up will have heatmaps captured.
Hotjar comes with three types of heatmaps:
Click and Tap Heatmaps:
If you’re using the tool on a mobile phone, it helps you determine which links on your website are most popular and whether they’re working correctly.
Hotjar Heatmaps – Clicks and Taps: Source: Hotjar
This lets you see if your links are in the right place and noticeable enough. It also enables you to see if users try to click non-clickable elements.
Move Heatmaps:
Hotjar Move Heatmaps work by tracking the movement of cursors and fingers while moving over a specific page section.

Hotjar Move Heatmaps, Source: Hotjar
It samples users’ mouse movements and uses a color scale to indicate which areas are visited more and which are less.
Scroll Heatmaps:
It tells where users scroll down to within a page and how far they scroll before leaving. This feature helps you analyze whether placing some aspects at a particular depth on the page improves the overall design.

Hotjar Scroll Heatmap, Source: Hotjar
Hotjar also lets you filter your heatmaps to display a specific group of users. Some of the filters include:
- Date filter
- Visited page
- Referrer URL
- Landing page
- Exit page
- Country
- Duration
- Page count, and more.
You can also use Heatmap URL Filters to view heatmaps on single or multiple pages. To do so, select the URL filtering option that you prefer from the available options, such as “URL contains,” “starts with,” “ends with,” and more.
In addition, you can also download your heatmaps in the form of JPG or CSV files.
FullStory:
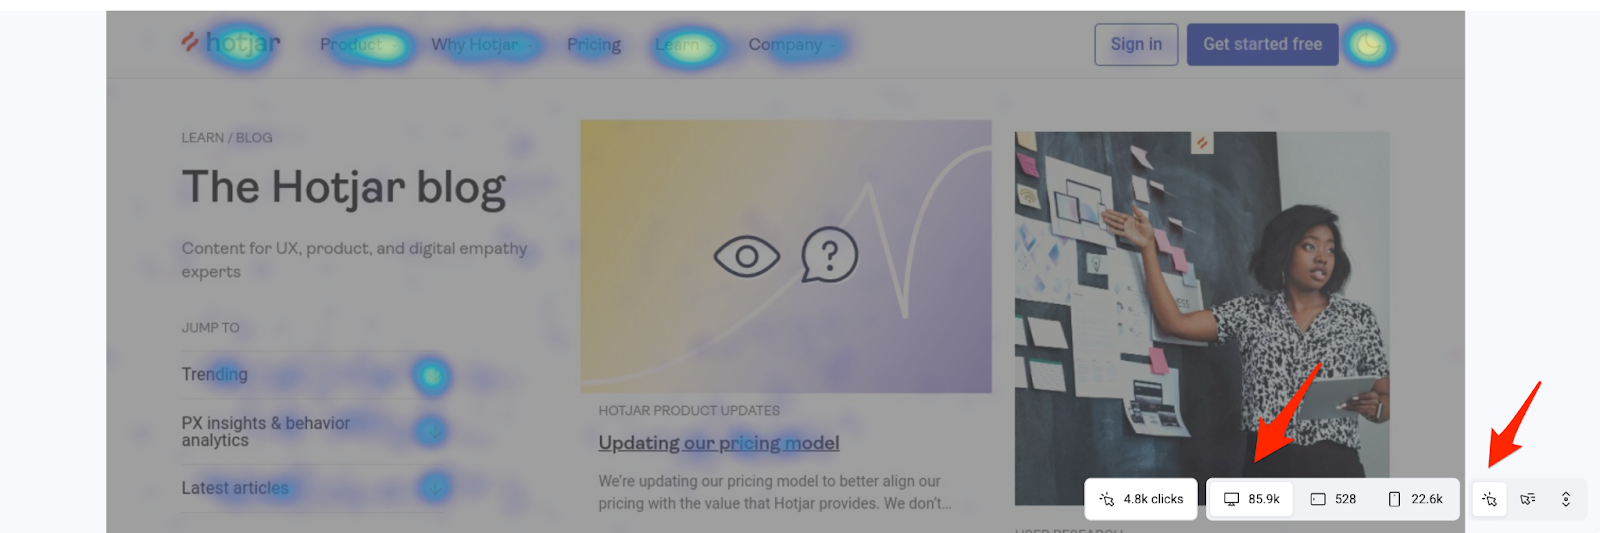
You can use FullStory’s Page Insights to see a visual representation of where users click and scroll on your site.

FullStory Page Insights (Heatmaps), Source: FullStory
You have two types of heatmaps to choose from: Click and Scroll.
When you enable the Engagement heatmap mode, you will see the most clicked, most error-clicked, most rage-clicked, and most dead-clicked elements on your site.

Engagement Heatmap, Source: FullStory
And just like Hotjar, FullStory’s scroll heatmap gives you a visual representation of scroll depth for your current page.

FullStory Scroll Map, Source: FullStory
You can filter insights based on device type, page views, and time frame.

FullStory Scroll Map Details, Source: FullStory
FullStory has another interesting heatmap type called Inspect mode, which lets you view the statistics associated with any element on the page by clicking on it.
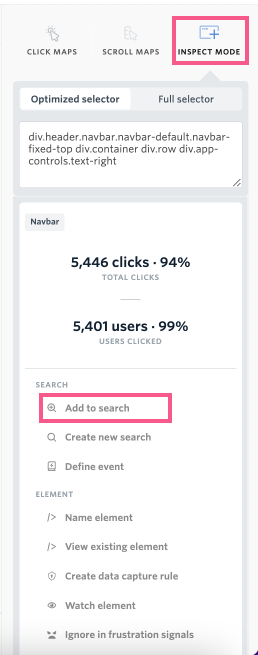
FullStory Inspect Mode, Source: FullStory
Quick Breakdown:
| Hotjar | FullStory |
| Hotjar captures three heatmaps types: click, tap, and scroll. | FullStory captures two types of heatmaps, including click and scroll. Plus, there’s the “Inspect Mode” to analyze each element in detail. |
| Combined with user feedback, these insights will save you from guesswork. | FullStory captures a lot of quantitative and qualitative data. To get a detailed analysis, you will have to dig through the funnels. |
| Hotjar has two types of filters: Heatmap session filters and Heatmap URL filters | FullStory offers filters such as most clicked, most rage-clicked, most-error clicked, and more. |
2. Session Recording
Hotjar:
Hotjar session recordings let you view the whole user journey. This includes everything the user does on your site, starting when they first visit. If the user has disabled tracking in their browser, Hotjar won’t record anything during that session.
The session ends as soon as the user switches to a different page on your website or closes the tab or browser window.
Here’s a glance at Hotjar’s session recording dashboard:

Session Recording Dashboard, Source: Hotjar
The dashboard gives you access to
- List tools – Recording list tools allow you to choose from 3 options: already played, not played, and all recordings.
Recordings list tools, Source: Hotjar
- Filters – Filters let you narrow your search or find something specific, like visitors who landed on your website but could not sign up.
- Segments – Segments allow you to save filter views to reuse them later.
- Traffic Coverage Widget – The traffic coverage widget displays the percentage of user sessions per day.
A Playback List section also displays highlights, relevance score, date, user, country, action, and more.
Highlights give you an overview of reactions and comments given on recordings; country indicates the user’s location, while duration shows the length of the recording. The referrer URL suggests where the user came from and the page the user was on before landing on your website.
To watch any screen recordings, click on the play button on the rightmost corner of that record.
You can also export this data into a CSV file.
FullStory:
After you enable FullStory, users’ sessions will begin as soon as they enter your website and end after they have been inactive for 30 minutes. Sessions show up in the Session playlist.

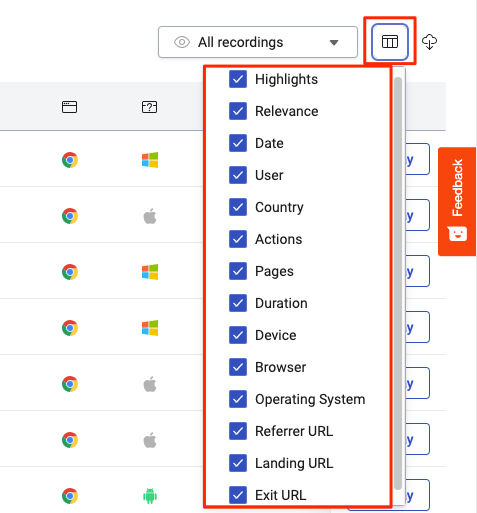
FullStory User Sessions, Source: FullStory
From this playlist, you’ll be able to see where the user is from and when they are most active. You can also see how often they interact with your site.

Session Playlist, Source: FullStory
You can use this data to see why users behave the way they do and where you can make changes to encourage them to stick around.
Quick Breakdown:
| Hotjar | FullStory |
| Hotjar session closes if the user switches to a different website or closes the browser. | FullStory session closes automatically after 30 minutes of idle time. |
| Hotjar lets you segment data by filter attributes like date, landing page, visited page, referral URL, country, duration, page count, browser, etc. However, the basic plan includes only a date filter, while additional filters are available with paid plans. | FullStory offers a range of powerful user filters and event filters. These allow you to segment data by user, activity, number of sessions, and more. |
3. Dashboards
Hotjar:
Hotjar’s Dashboard shows your key metrics all in one place, using charts and graphs. The Dashboard keeps you in the loop about important events, so you can quickly see what needs improving or fixing.

Hotjar Dashboard, Source: Hotjar
The Dashboard will give you a detailed, collected view of the following parameters:
- Top countries
- Top pages
- Avg session duration
- Total sessions
- Bounce rate
- Rage clicks
- U-turn trends
- Device
- Operating system
- New user session
- Returning user session
You can also create views and apply filters to compare conversions, monitor trends, and identify the reasons behind your most common user queries.
FullStory:
FullStory also has a dashboard that gives you a birds-eye view of your progress, alerts you to seasonal user behaviors, tracks feature adoption, etc.

FullStory Dashboard, Source: FullStory
For example, if you have an eCommerce store, FullStory will show you the average number of conversions and checkouts in the last 30 days. It will also indicate whether there has been an increase or decrease in traffic.
And unlike Hotjar’s dashboard, it’s customizable and lets you mix and match different cards to build dashboards aligned with your product, UX, and other teams.
FullStory Dashboard also displays an overview of frustration signals regarding Rage clicks. It will show you the total number of Rage clicks from the last 30 days and an increase or decrease percentage.
It also displays the total number of errors on the sign-up page during the last 30 days.
Finally, if you look at the graphs below the three cards, you’ll see how users interact with the site and where they flow from one page to another.
Quick Breakdown:
| Hotjar | FullStory |
| Hotjar Dashboard gives you a more holistic view of key metrics between the custom dates. | FullStory Dashboard uses graphs and charts for visual data presentation and three cards that provide an overview of conversions, rage clicks, and JS errors for the last 30 days. |
| Hotjar Dashboard gives you detailed analytics in the form of data, including top countries, top pages, click rates, bounce rates, u-turns, devices, and more. | FullStory Dashboard provides insights into conversion, errors, rage clicks, checkout flow, and subscribers. |
| Hotjar doesn’t offer customizable dashboards. | With FullStory, you can build custom dashboards based on your goals. |
Hotjar Unique Features
Feedback Tool
Hotjar is a tool that allows you to collect visual and quick feedback from users while they are interacting with your website. This means you can be sure about what your users liked and disliked on your page and get clear feedback for improvement.

Hotjar Feedback, Source: Hotjar
You can choose where your feedback form will appear – the middle left, middle right, bottom left, or bottom right. You can customize question steps, appearance, targeting, and feedback responses. For appearance, you can customize widget label texts in a paid plan.
For question steps, you can have the survey automatically take a screenshot of each response. You can also add/edit custom text at the bottom of each page. One step ahead, you can also ask users for their email addresses when they submit their feedback.
You can even choose whether the feedback widget shows up on all devices, only mobile devices, or a particular URL.
Surveys
Hotjar offers users a variety of survey options, including long and short text for surveys, yes/no questions, radio buttons, checkboxes, rating scales, and statement options.
You can ask visitors to complete surveys as they move across your website and store unlimited surveys for as long as you need.
The best part? You can build surveys from scratch, as Hotjar offers multiple pre-built survey templates.
FullStory Unique Features
Frustration Signals
FullStory shows you when and why users get frustrated – by displaying rage clicks, error clicks, dead clicks, and thrashed cursors.
Rage clicks happen when a user clicks or taps rapidly on the same area of your site. This can occur when they are frustrated with a particular element performing differently than expected, like a button that doesn’t respond or a form that isn’t loading.
Error clicks are explained as JavaScript errors or console errors. Dead clicks suggest that the user clicked/tapped, but nothing happened on the page. Thrashed cursor means the user is circling the mouse on the page, which suggests confusion or waiting for a response from a slow website.
All these signals can help you fix broken elements on your page.
Funnels & Conversions
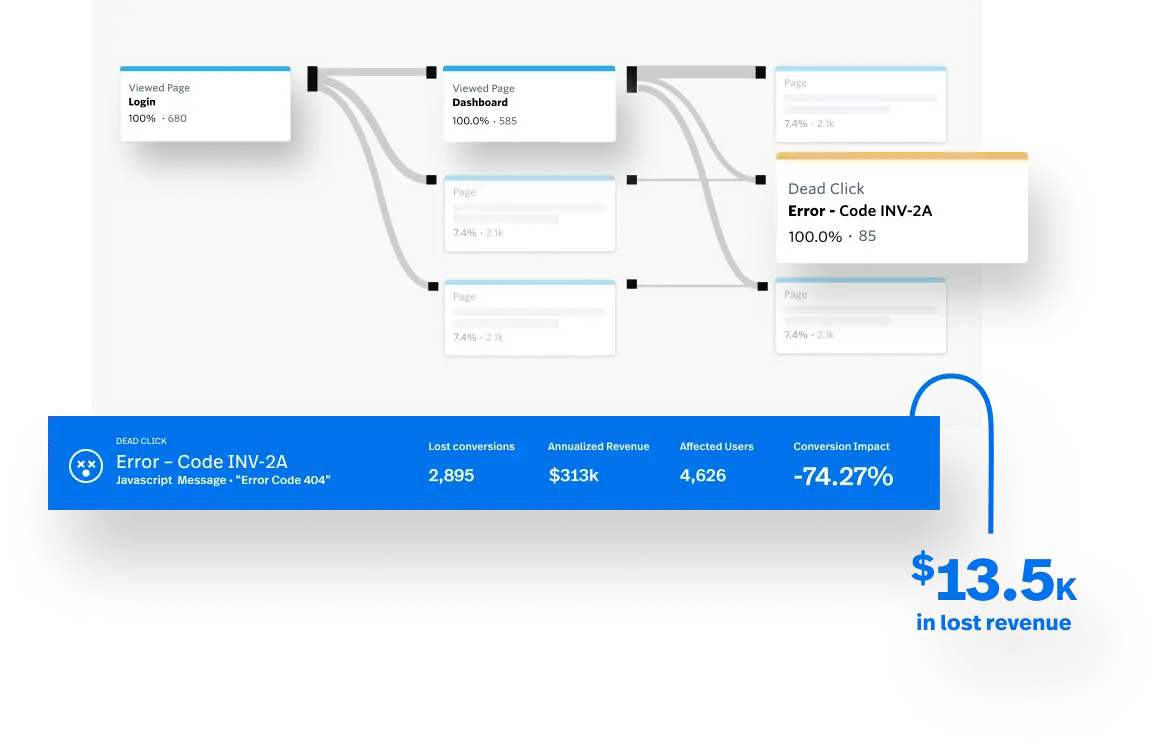
FullStory’s Funnels & Conversions analytics tool gives you a detailed view of what people are doing on your website.
Most importantly, it allows you to determine which actions are taking place before and after conversions. You can tell if someone abandoned their cart or whether they browsed around without buying anything. This helps you determine whether your path is working and whether it’s getting the conversions you expected.
It also provides a complete picture of lost conversions, affected users, conversion impact, etc., using metrics such as rage clicks, dead clicks, error clicks, and more.

Funnels and Conversion analysis, Source: FullStory
This will allow you to reduce problem-solving time and make adjustments faster. You can even use the data with session replays to improve your customer experience.
Journey Mapping
With user journey maps, you can learn how users flow through your website and identify which areas are most successful with conversions and which are not.
User Journey Map, Source: FullStory
You can collate all this data to build better paths for conversions.
Hotjar Pros & Cons
| Hotjar Pros | Hotjar Cons |
| All Hotjar plans let you store unlimited heatmap data. | Filter options are limited with their basic plan. |
| It offers customizable survey templates to save time. | It does not offer dynamic heatmaps. |
| All Hotjar plan allows heatmap storage for 365 days. | The dashboard for analytics and data isn’t customizable. |
| It offers unlimited surveys with unlimited storage. | Hotjar does not support Flash content in heatmaps. |
| Extremely user-friendly and simple to set up | Hotjar cannot capture behavioral data from the pages that use scroll-lock. |
FullStory Pros & Cons
| FullStory Pros | FullStory Cons |
| FullStory gives you complete data for each user. | Does not have feedback or survey-based features. |
| It allows you to learn about user behavior in depth and build your solution accordingly. | It can be overwhelming to see how much data it fetches for you. |
| You can create custom dashboards based on your requirements. | |
| FullStory lets you analyze important metrics, such as rage clicks and dead clicks. |
Hotjar vs. FullStory Pricing Plans
Hotjar offers four pricing plans, including one free and three paid plans.

- Free – 35 daily sessions, max 1050 sessions/month, unlimited heatmaps, and automatic data capture.
- Plus (starts from $32/month when paid yearly) – 100 daily sessions, up to 3000 sessions/month, data segmentation and filters, and events API.
- Business (starts from $80/month when paid yearly) – Starts from 500 sessions/day. Custom integrations. Identify API, frustration and confusion signals, and Hotjar branding removal.
- Scale (custom plan) – Unlimited daily sessions + everything in the Business plan.
Plans that include surveys and feedback features start from $48 per month.
FullStory offers two pricing plans:
- Enterprise – suitable for large organizations with multiple teams working together. Price to be requested.
- Business – Offers a 14-day free trial for growing teams looking to explore trends and plan their journey accordingly.
Over to You!
When we considered the differences between Hotjar and FullStory, an interesting thing became clear: they aren’t all that different.
Both are comprehensive, feature-rich tools with unique benefits. Ultimately, their differences boil down to two main points: FullStory records what users do on a page, while Hotjar also asks users questions about their experience through on-site surveys. That said, FullStory has an edge with additional features like journey mapping, frustration signals, and funnels.
The real challenge is finding the right one for your business’s needs.