

There are a lot of heat map tools out there, but not every one of them fits everyone.
Different people have different needs, but not everyone knows exactly what they want.
That’s why I thought about writing this blog: to help you know what you’ll need and how it can help your business grow.
What are heat map tools used for?
Heat map tools are used to collect data from people’s actions on the site.
Heatmaps, in particular, are just a way of collecting this type of information about your visitors’ behavior and understanding what they’re doing when they visit your website.
Each time they click an element on the webpage with either mouse movement or by touchpad gestures (or if it’s enabled), that action will go into the heat map tool, where it’ll show up as a pixel-colorized square, circle, or dot, depending on how big was the interaction.
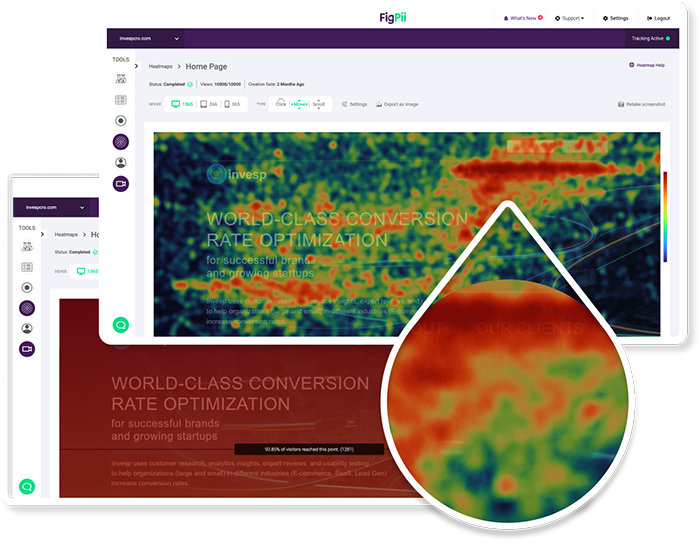
A heat map tool like FigPii will help you understand what visitors like and don’t like about your website while also helping improve the conversion rates by understanding how they found your page (through buying keywords?), how long they stayed there before moving on or purchasing something, and more.
This information helps us create better landing pages as well as pages that have higher conversions because we’re designing them in ways our customers want.
All this data is collected in heat map tools like FigPii.
What are the benefits of using a heat map tool?

The most obvious benefit is that you can track where your visitors clicked and how they interacted with your website, from clicking on links to scrolling up or down the page.
All this information helps us create better landing pages as well as pages that have higher conversions because we’re designing them in ways our customers want.
Another benefit of heat map tools like FigPii is that they’ll show you where there are errors in your design.
As we know, people don’t always tell us what they want, and other times, it’s not even possible to ask them.
So heatmaps let us see the mistakes our visitors made when interacting with the page by connecting patterns of pixels to a specific action on the webpage.
For example, if your heat map tool has a heatmap of a webpage and you notice the people are clicking on an element that is not clickable (the button), then something is wrong with this design.
This could be due to color contrast or size – all these things can affect how visitors interact with your website.
If they’re having trouble interacting in some way, like reading text, for instance, because of font size or color choice, heatmaps will show us where the problem lies without asking our visitor what’s going on!
Why FIgPii is the only heat map tool you’ll need?
No tool in the world fits every business; let’s just get that out there.
But what I’m talking about is why you subscribe to multiple tools or even pay more for just one tool to give you what you need, while FigPii gives you all that you want in one package.
Let’s dive into what I mean by that.
Why use a heat map tool?
Heat map tools are a great way to uncover insights that you can’t know without them.
Things like:
Conversion Rate Optimization
You can use heatmaps to identify if there’s something wrong with your funnel or if users are taking a different approach than the one you planned.
You can find low-hanging fruits that you can optimize, like:
- The site not being optimized for mobile view properly
- Multiple Call To Action or Offers
- Unnecessarily long registration forms
It can tell you what users look at before making a conversion, which gives you a great insight into what you should double on to increase your conversions!
It offers your customers a frictionless experience when using your website or application while giving you a window into their minds.
Content
When writing content, you might be interested in looking at Google Analytics to try and come up with a rough idea about whether your users find your content worth reading.
So you look at bounce rate, time spent, traffic source, etc., right?
But you’re missing one huge factor in your equation.
What section grabbed the most attention?
A heat map tool will show you where your visitors are clicking, scrolling, and how long they’re staying.
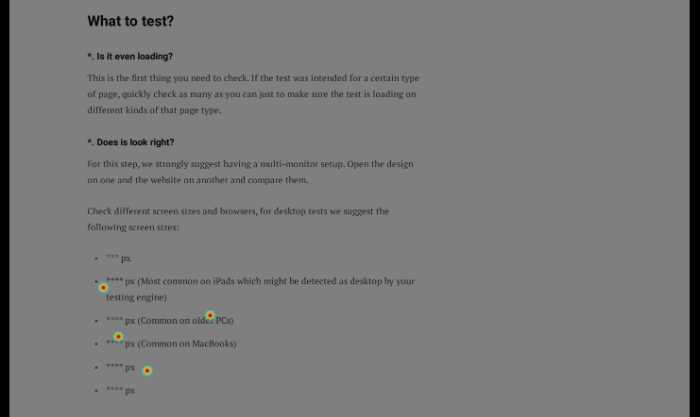
This lets you know if people find your content worth reading or not because it’ll highlight the parts of the article that were clicked on.
When we look at the heatmap below, we can see that people are interested in some measurements that we included in our blog.
Better UX
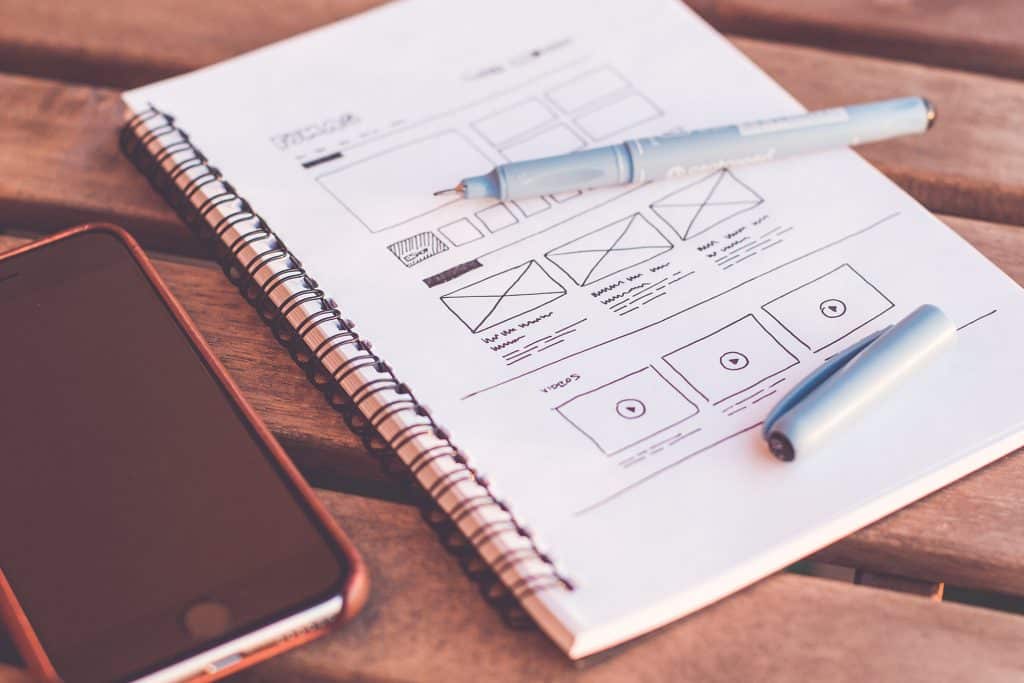
Heat map tools help you test your UX without asking your customers if they’re finding the new design good or not.
This is because heatmaps show you where your visitors click and what they do on the page.
If people are having a hard time finding something on the website, heat maps will let you know without asking them!
You can also use heatmap data to inform decisions about what features need more attention as well as how important certain parts of an interface should be.
With that out of the way, we’ll move to why you should consider FIgPii.
Why FIgPii is the only heat map tool you’ll need!
The thing about FigPii is it isn’t just a heat map tool; it’s a full conversion rate optimization toolbox.
What you get with FigPii:
– Heat Maps
– Session Replay Videos
– A/B Testing Suite
-Website Polls
So how does that help you get more out of your heat maps?
To answer such a question, I’ll give you some use cases for how you can drive more actionable results using heatmaps.
Heat Maps and A/B Testing
The thing about heat maps is that you’ll need to make changes based on your analysis.
But humans aren’t all the same, and while you might make a design that you think will bring you more conversions, it turns out to be a flop.
And that’s the hard truth, so what you need to do is to A/B test everything.
If you think that you need to make a change, you first need to A/B test it.
Once you’ve done your A/B test and you’ve come to a conclusion either confirming or denying your hypothesis.
If it’s confirmed, you should make the changes and roll out them to your live site.
Heat Maps and Site Polls
Site polls are a great way of getting feedback from users who take the time to answer your survey on what they think about something you’re working on.
But how do heat maps help?
Heatmaps make it easy to determine which part needs attention in order to create the best experience possible!
You can run polls and ask people to see if their response to your poll matches their behavior.
Let me give an example of that.
Canvas Flip a publisher on Medium wrote a blog about his users saying something but doing the exact opposite.
“The point is, you cannot ask users what they want. My team and I recently conducted a study. The participants told us that they used a feature on a “regular” basis. But when I looked at the analytics, I witnessed a different story: they only used the feature maybe every 3–4 months.”
Heat Maps and Session Recordings
Session recordings are a great way of letting you see what your visitors are doing on your website without having to install video recording software.
But heatmaps help by giving the “big picture” and showing where the visitor clicks, scrolls, and stays for how long.
It also tells you when someone leaves an area in just one second, which is really telling as well!
In a heat map report, you’ll see how much time people spend on your page as well as where they click!
Conclusion
Heat maps are a great way to understand your visitors and what they want, leading to more conversions.
While heat maps can give you such rich analytics and insights, if you want to maximize your conversion rate to its fullest potential, then you need a full suite of tools.
FigPii is the only heat map tool you’ll need because it has everything you need in one suite.
It has:
– Heat Maps
– Session Replay Videos
– A/B Testing Suite
-Website Polls
FigPii specializes in providing high-quality web analytics tools such as heatmaps, user polls, A/B testing, and session recordings, so sign up today for 14 14-day free trial period and see how we can grow your business together!
