

When was the last time you looked at a heatmap of your website?
Today? Yesterday? Doesn’t really matter; you had a reason that made you take a look.
That reason might be that you’re looking for something, like what’s causing a drop in conversions, to see how people react to your new website design, how far are they scrolling and where they are clicking exactly.
But, I actually want to tackle another big question that you might not have thought about deeply before.
When are heatmaps most useful?
Such an open-ended question right? But I intend to give you a satsifying answer – all you have to do is continue reading this article.
Before I dive into it I just want to give a brief introduction about heatmaps.
What are heatmaps?
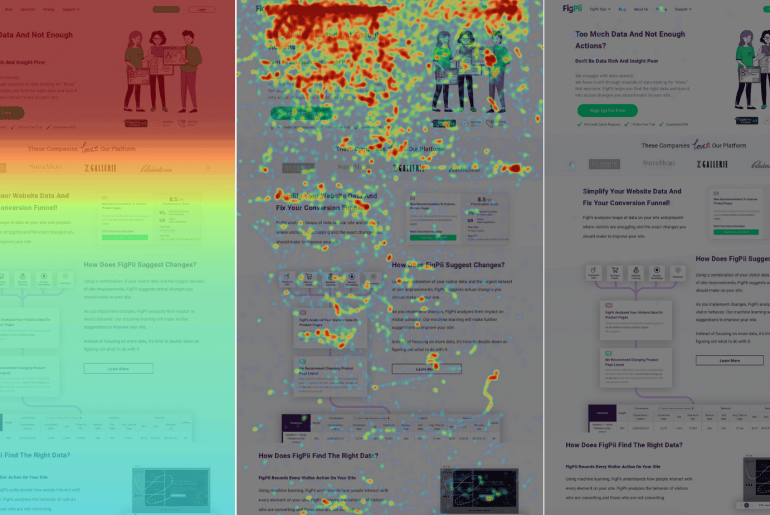
Heatmaps are a graphical presentation of people’s interaction with your website presented in the form of a map.
A map that changes colors based on if people are taking action on it or not.
With different maps, actions performed by the user differ greatly.
I’ll give you an example, heatmaps are usually divided into 3 main types.
Click maps, Scroll maps, and Mouse movement maps ‘eye-tracking maps’
With each type of these maps, the action tracked is rather different.
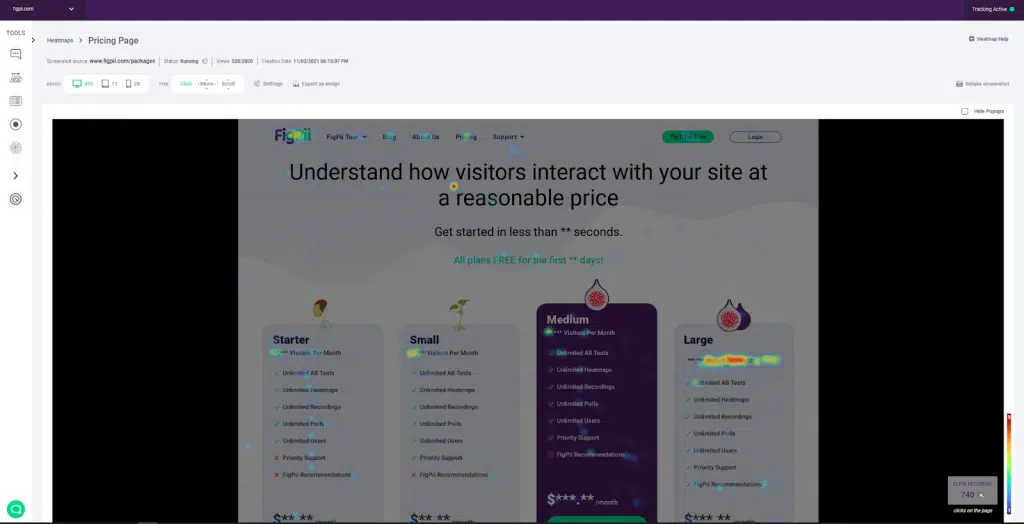
Take for example the click maps, they track where your customer clicks on your website.
Like if they have a slider that shows the photos of your customers and you see clicks on the arrows then you know people are interested in seeing social proof.
They want to know who you’ve worked with before so they can be more confident in working with you.
Maybe you have a CTA button at the top of your page that people miss most of the time because its color is close to the background.
There’re endless uses of click maps by business owners, marketers, and UX designers.
And if we look at scroll maps for example.
The action that this heatmap track is actually scrolling.
It tells you how far scrolled down your page, be it a product page or a blog.
If you’re debating whether long-form content is dead or not, scroll maps are the way to answer such a question.
And lastly, we’ll talk about mouse movement maps, which can sometimes be called eye-tracking maps.
They’re called that because when people usually browse or read content they usually do it by hovering the mouse over the content and moving the mouse pointer as they moved their eyes.
And you can see easily how people interact with different types of messages on your website by looking at mouse movements patterns.
Why should you use heatmaps?
If conversions are something that you care about, then you should have heatmaps running on your website.
The next section will be talking about when heatmaps can be most useful, but before we answer when we should answer why.
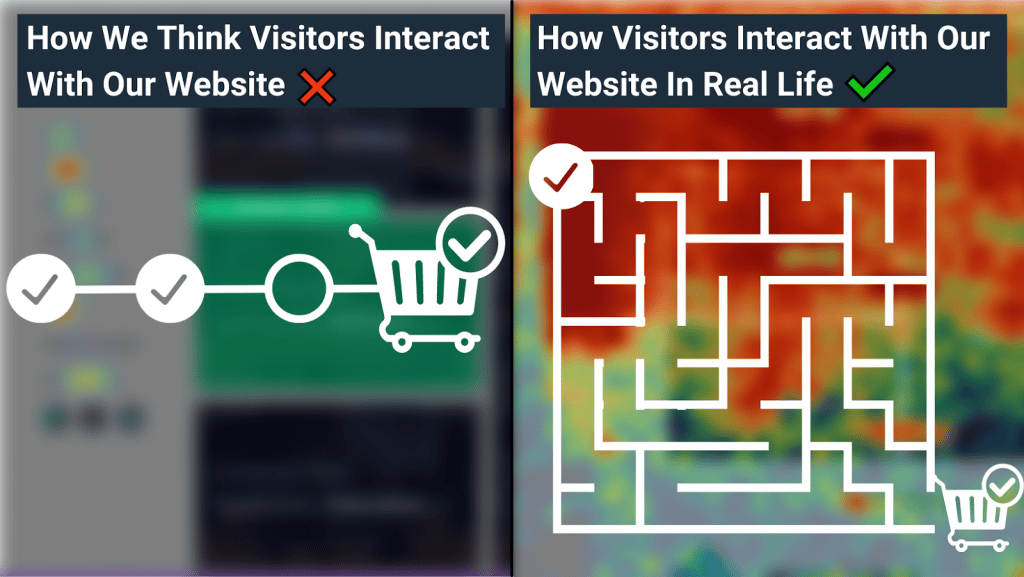
Heatmaps show you the things you don’t understand and sometimes miss.
Visualizing the customer journey is something you need to do accurately if you want to convert more users.
And heatmaps helps you visualize the journey without having to watch hours of recordings of your users navigating your website.
FigPii’s heatmaps also give you info like
- How many clicks came from each platform (Desktop vs Mobile)?
- How many clicks did each element get on your website?
- How far did people scroll down per platform (Desktop vs Mobile)?
- How many views did the page get?
Answers to the above questions are crucial when doing conversion optimization on your website.
Take for example, the first point (How many clicks came from each platform (Desktop vs Mobile), if you notice that mobile visitors are not clicking on your CTAs, they are just scrolling past them. Then you’d know that there is an issue. It’s either your CTA is not visible enough on mobile its placement is wrong altogether.
And that’s just one example of one way you can use the data FigPii heatmaps offers you, you’ll have a lot more insights that lead to better marketing decisions down the road.
When are heatmaps most useful?
Well…
It depends on what’s your goals from that heatmap.
If you look at it from a funnel perspective, each step of the funnel will match a goal.
Like if you’re now focusing on the awareness level then you might want to look at what content is getting the most attention.
If you’re looking at maybe acquisition level then you might want to track your money page and see if there are any improvements to be made.
I won’t talk about each level now but you get the idea.
Also, the same level can have multiple goals that you want to track using heatmaps.
Like if you’re at the acquisition level you might look at how different value propositions and CTA buttons perform alongside each other.
The value proposition is one element, but the CTA button is another, you can track each independently or have a report for each of them.
So heatmaps are extremely versatile when it comes to tracking stuff on your website and getting insights.
You just need to know what you want from it, why, and *when* which is the question we’ll be answering today with you.
Mainly heatmaps would be the most useful when you …
- Have a conversion issue but can’t figure out what’s causing it:
You have a good-looking website, but for some reason, your conversion rates are lower than the industry average conversion rates.
It might be that your users aren’t really behaving as you think they should.
They might be skipping over that CTA that you want them to click on.
Or maybe they don’t really know what to do once they’re on your website. Heatmaps can help figure out these conversion traps without breaking a sweat.
- When you’re trying to figure out if your content is engaging enough
Do you ever wonder what works better? Long-form content or short-form?
I’ll tell you now, whatever answer Google ends up giving you it isn’t it.
Because what works on someone else’s website doesn’t not necessarily mean that it will work on yours.
So copying what works for other brands isn’t a solution and it can even backfire.
I recommend launching a scrolling and seeing for yourself which type of content works for you.
If you feel like you’re ever in doubt, and you don’t know the content format to use, just launch a heatmap and get the answers from your users directly.
- If you’re trying to figure out messages/elements that resonate with different traffic sources.
Your traffic is as diverse as a tropical forest, and there isn’t a one-size-fit-all when it comes to messages directed at your customers.
And delivering the right message to the right audience can be crucial.
Like if you’re running a PPC campaign and you have a heatmap running on your website you can easily tell which message – or elements like graphics and designs – work the best for visitors coming through that channel.
People who come from a Google Ad that promotes running shoes might not be interested in knowing more about your high heels.
- Figure out the best messaging placement on the site.
Having the right messaging is half problem solved. The other half?
The placement of that message.
While yes you need to have a nicely crafted message that you present to your customers, when and where you place is also something that you should not ignore.
If they land on your website and see a generic hero message while your killer copy is below the fold then that’s a problem.
Testing out where to have your messages on your website is as crucial as the message itself.
- See how Desktop vs Mobile users interact with your website
I think this is one of the most important uses of a heatmap in marketing!
Simply said, people react differently to different layouts on different devices.
And it shouldn’t come as a surprise, this is a mobile-first world, and most of your visitors are more likely accessing your site through mobile devices.
Like truly, we get most of our traffic from mobile devices, followed by desktop and lastly tablets.
So I’d definitely recommend comparing how user interaction on desktop vs. mobile – you might bump into some interesting conversion insights there.
I’d also tune in to Khalid’s and Simba’s CRO live hour on Thursdays to know more about LP designs and CRO.
Heatmaps are most useful when combined with other CRO Research Techniques
- When combined with A/B testing to get more insights.
Heatmaps show you how people react to your designs and copies, A/B tests allow you to know which ones perform better, combined these two and your conversion research will be on steroids.
You might see that a certain message is working well, but people ignore the design below or above it.
So you start switching stuff around, seeing what works better with what.
By doing that you give yourself more options to test and get the best results possible.
- When used with session recordings to visualize funnels.
Heatmaps show you an aggregated image of what users do on your website and how they behave, combine that with a session recordings? You have unparalleled insights.
You know on a high level how most people interact with your website, but you also know exactly how a single visitor interacts and you can watch her do it.
A combination of session replays and heatmaps allows you to live inside your visitors’ or users’ minds without creeping them out.
- When combined with online polls
Have you ever tried asking what goes on your customers’ heads? But in a poll?
Of course, you haven’t, but open-ended questions combined with heatmaps are the nest best thing!
Because you can’t expect people to answer your questions in detail, you ask the things that you can’t see with a heatmap, like what brought them here today, or what kind of heatmap tool are they looking for?
And you try to distill the possibilities of why users take certain paths.
Patterns will emerge because to no surprise, customers usually act similarly to each other.
How to install heatmaps in a couple of steps?
1. Log in to FigPii.
2. The FigPii code will appear at the bottom section of the dashboard3. Click on “copy code”4. Paste the FigPii Tracking Code into the <head> section of your website.
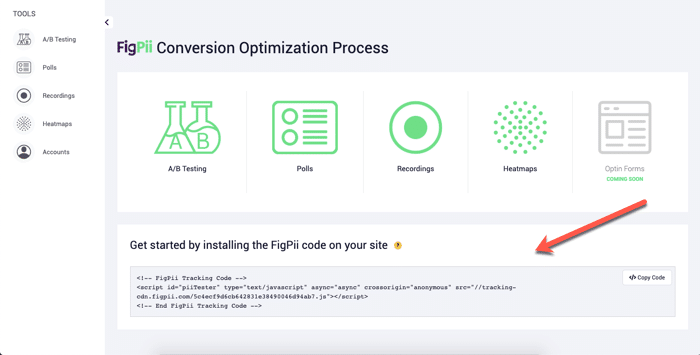
3. Click on “copy code.”
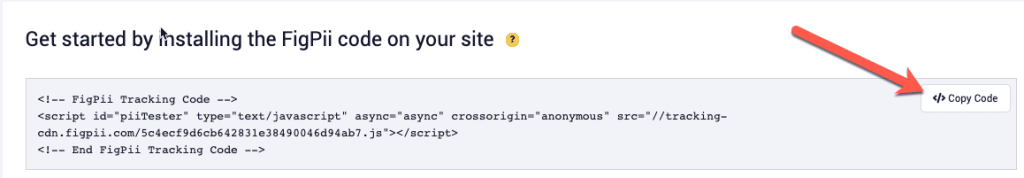
4. Paste the FigPii Tracking Code into the <head> section of your website.
FigPii integrates with major CMS and e-commerce websites, check our full list of integrations right here.
5. Check your FigPii dashboard to verify the installation. When the tracking code is installed on your site, the tracking indicator will show you that the code is active.
Once you have added the FigPii Tracking Code to your site, you will need to wait for about an hour to check if it is installed correctly. This usually happens the moment your site is loaded with the FigPii tracking code installed. But there can be a delay for up to an hour before it shows as “Active”.
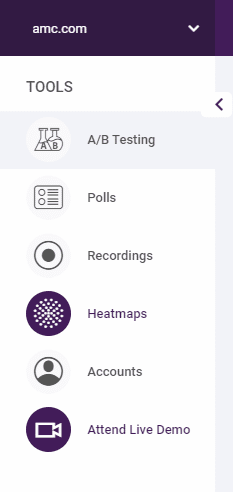
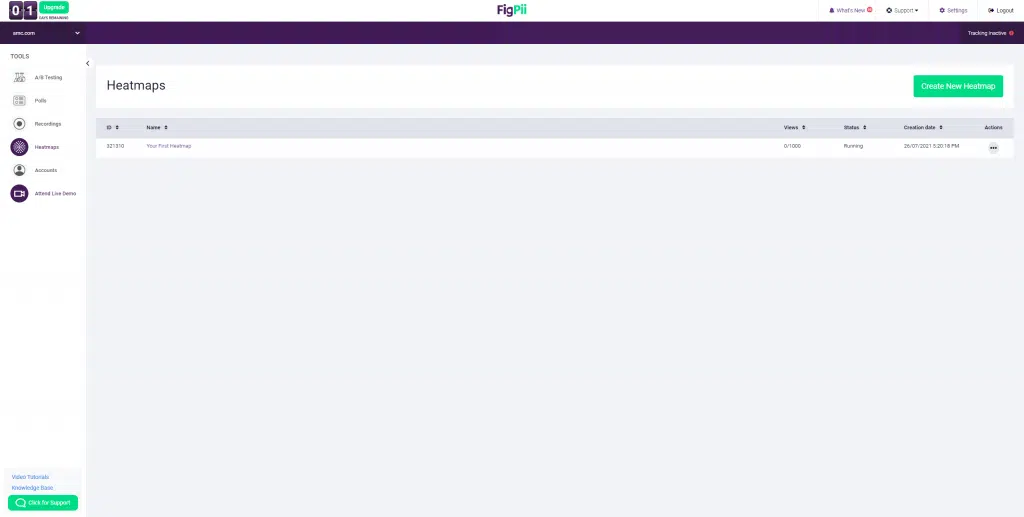
6. log in to FIgPii’s dashboard, and go over the heatmap section from the side menu.
7. Press on create a heat map
8. Name your heat map
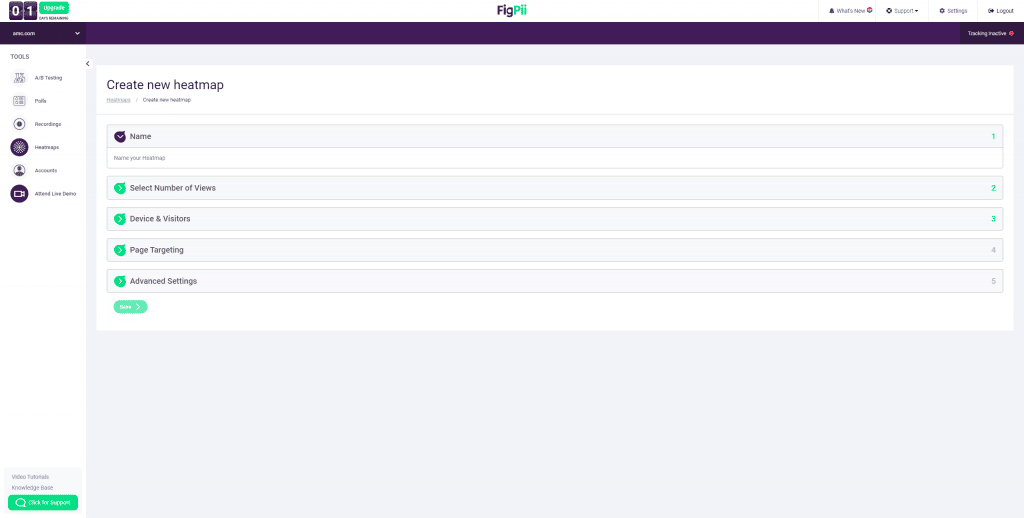
9. Choose the number of recordings that you want
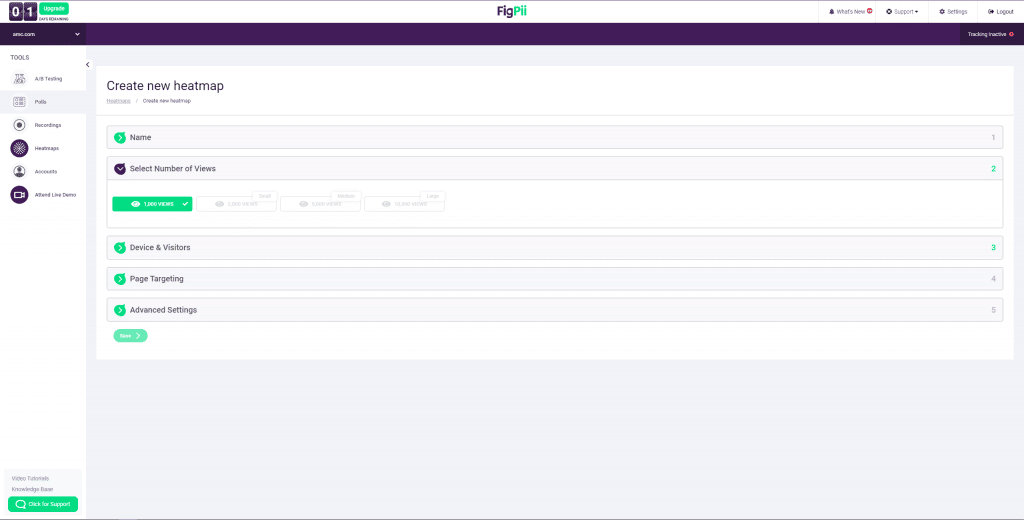
10. Choose which platform you would like to record, you can choose mobile or desktop.
You’re also able to track new visitors or returning users.
11. Choose which page or pages you would like to track with your heatmap.
12. Configure your map with advanced options that help you create more accurate data
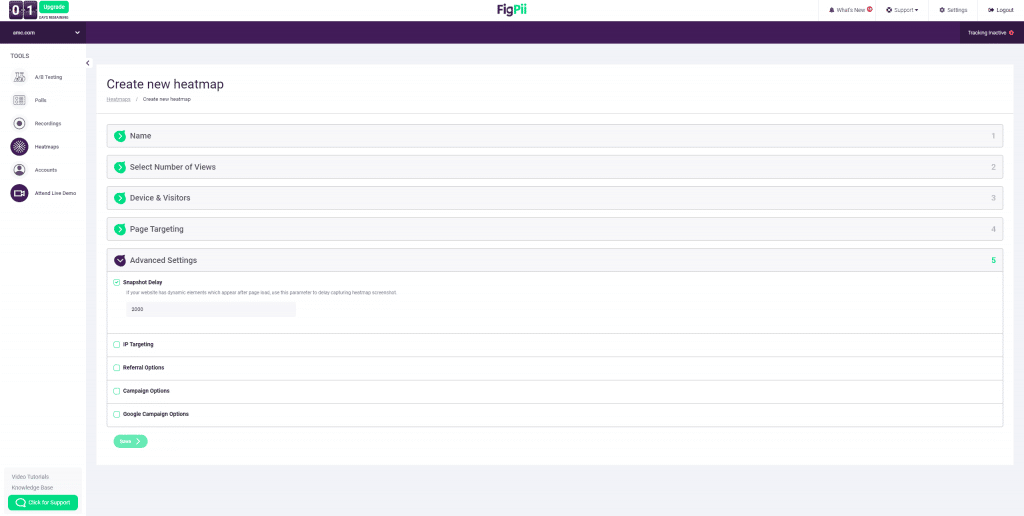
You’re done! Now you’ll be able to track your users like you never could before.