

We can all agree that heat maps, session recordings, A/B tests, and on-site polls play a critical role in conversion optimization. The insights you get from all these conversion research techniques can help enhance your site’s UX and ultimately, conversions.
In our previous post – the role of heat maps in a CRO program – we highlighted the insights you can get from heat maps. Which are:
- How to optimize content length,
- How to improve menu item placement,
- How to position your CTAs,
- How to redesign your landing pages,
- And, how to optimize for mobile usability.
Session recordings or session replays can help you:
- Understand your visitors’ behavior, like the pages they go to, time spent, clicks, and scrolls.
- Seeing how they interact with the different elements on your website,
- Finding out bugs and other issues, through identifying barriers that hinder the visitor from completing an action.
- Knowing why certain users bounce from the website without doing any action.
Moreover, A/B testing allows you to:
- Improve user engagement. Testing changes done on different elements of your landing pages will show which one of them affected users’ behavior and which did not. And, adding the winning variation of each of them will improve user engagement.
- Reduce bounce rates. A/B testing helps you figure out which elements on your page make people spend longer time on it.
- Reduce cart abandonment rates. The same as reducing bounce rates, A/B testing helps you figure out which elements on your page make users reach the checkout after clicking “buy”.
- Increase sales. A better UX makes users trust the brand enough to buy from it.
Polls also have their place in conversion optimization. They help you:
- Releasing the need for new products or improvements to existing ones,
- Finding UX bugs,
- Locating process bottlenecks,
- Knowing the reasons behind users’ abandonment.
All of these insights and data are super powerful for any e-commerce website, but then what? How can they be powerful? What will you do with them? What are the actions you are going to take to increase your conversion rate?
According to several interviews we have conducted with users of some of the top SaaS companies offering the above tools, they didn’t know how to use this data.
The interviewees found it hard to go through 1000 session recordings, look at every heat map, poll, A/B test, and look at Google Analytics. So, the data accumulated.
Most of them didn’t know how to draw solid conclusions from these insights. They didn’t know how to move forward. They didn’t know how to come up with ideas from the data.
My mantra here is: Follow the data, not your guts.
And, that’s where the FigPii Recommendations tool comes in!
What is the FigPii Recommendations Tool?
FigPii Recommendations tool helps analyze A/B tests, heat maps, session recordings,, polls, and other website metrics on e-commerce websites. Based on the data, it gives you several ideas to test.
For example, the tool will tell you that users are looking for more copy and text on your product page and are not satisfied with the amount of information you provide. So, do you want to launch another A/B test? Or go ahead and add the text directly on your website?
How Is FigPii Helpful for E-commerce Websites?
In e-commerce websites, you mainly have two concerns:
- How to increase traffic on your website?
- How to increase your purchases? How to increase the number of people to convert?
The FigPii Recommendations tool can help you with the second point. It gives you recommendations along with the data they are based upon. It shows you why it recommends this idea, which will help you convert more of your traffic into paying customers.
Now, Let Me Provide You With Actual Examples of Recommendations:
Here are some examples of successful A/B tests we had conducted before we established the FigPii Recommendations tool that will help you understand it more.
These examples show ideas our Client Delivery team came up with, similar to the kind of recommendations the tool will provide you with.
Navigation A/B test examples:
This screenshot is for an ecommerce website that has four to five different categories. This test was meant to smooth the navigation across the categories to increase revenue.
In the old design on the left, in order for users to go to any of these categories, they had to:
- Go to the hamburger menu,
- Then go to categories,
- Then go to a page they called ‘Shop All’ that showed all the products at once,
- Then from there, they could navigate to the needed category of products.
In this A/B test, we made it simpler for users to find the different categories by adding a sticky menu (the colorful labels at the bottom of the screenshot where the arrow is pointing).
This test had a 13% increase in conversion rate, causing additional revenue from this variation.
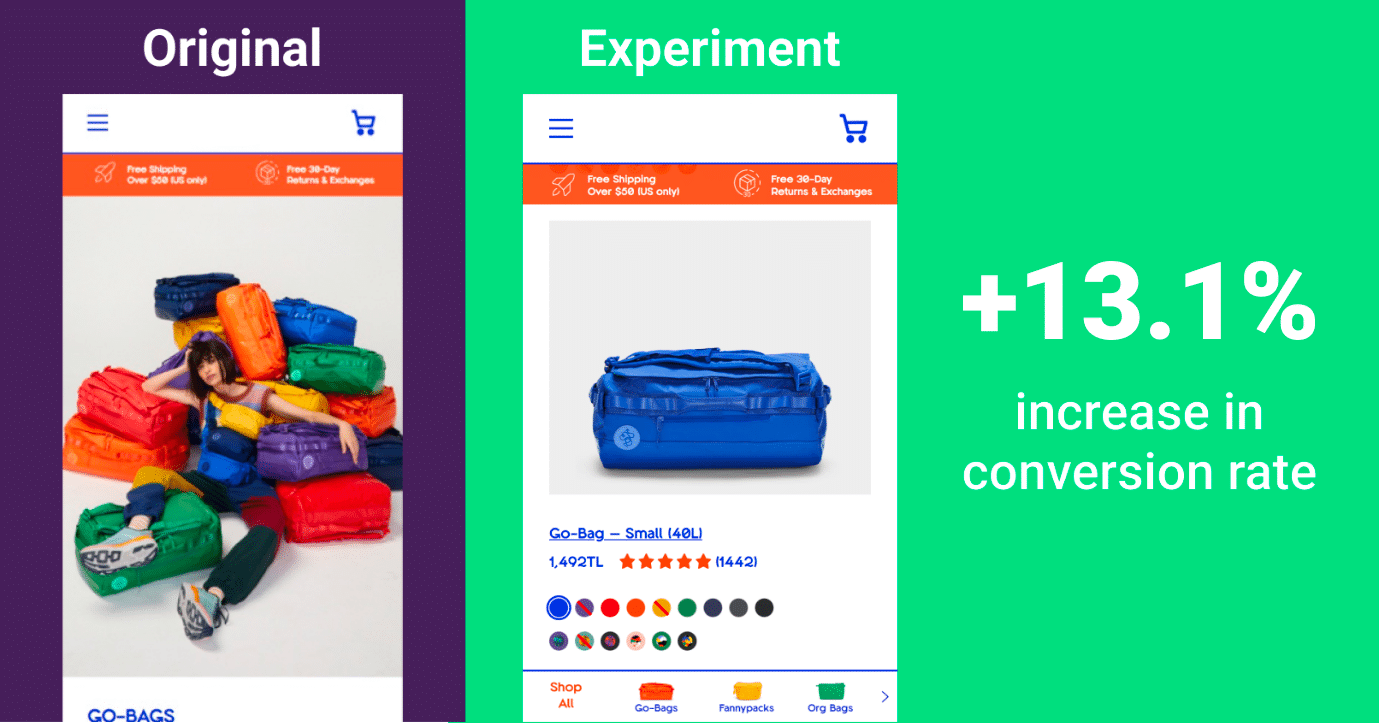
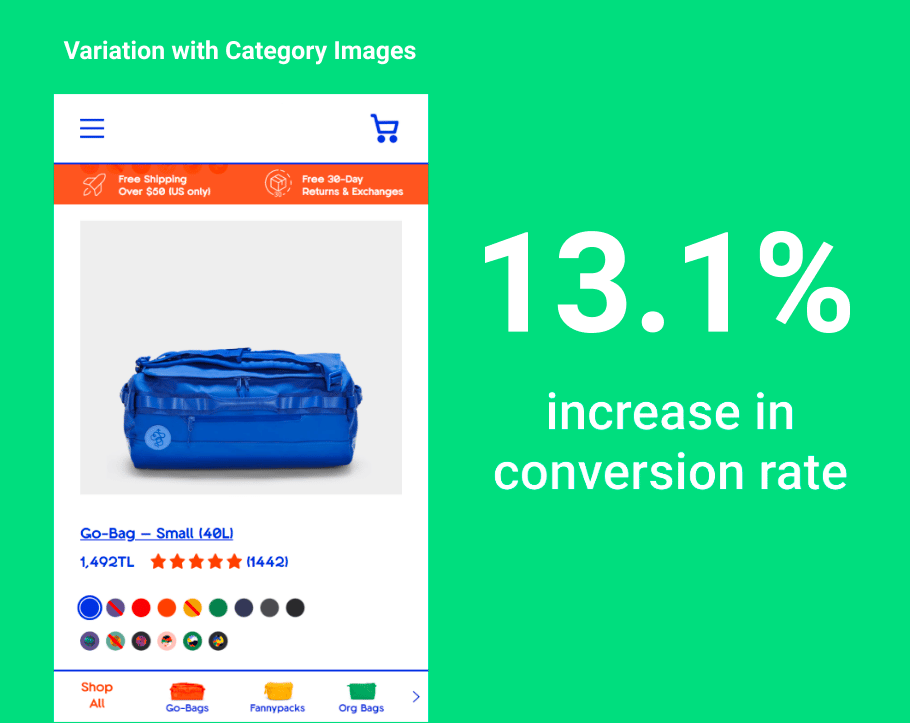
This A/B test had two variations. One had images of the products, and the other didn’t; it only had the names.
The one with the images was the winner, which resulted in a 13.1% increase in conversion rate.
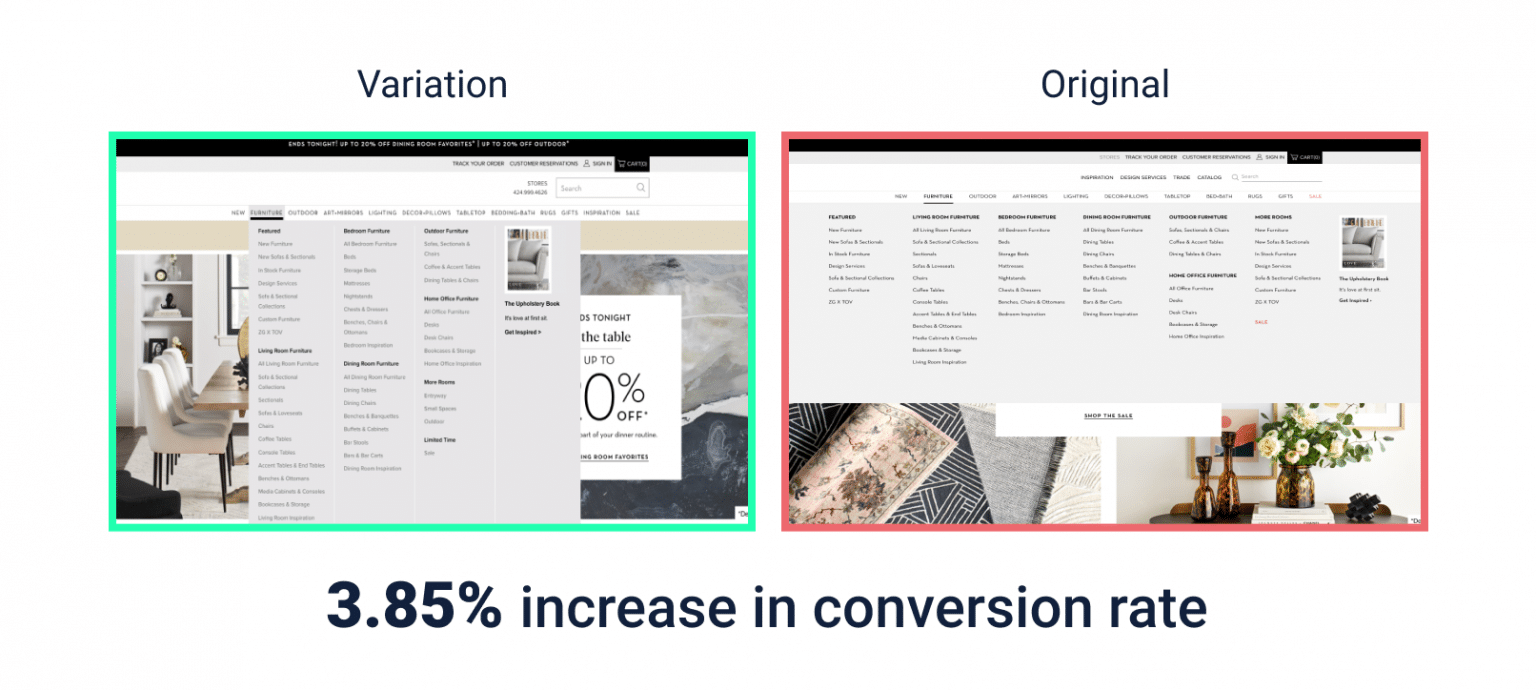
This furniture e-commerce website had a very confusing menu for users. They were hovering over it a lot. There were too many options for them.
We made the menu wider for users on desktops instead of them being on top of each other. Each one of them now gets an individual row with more space.
This new design caused a 3.85% increase in conversion rate for a website that sells 30 million dollars worth of products. This is considered a fair percentage.
Free Shipping A/B Test ideas:
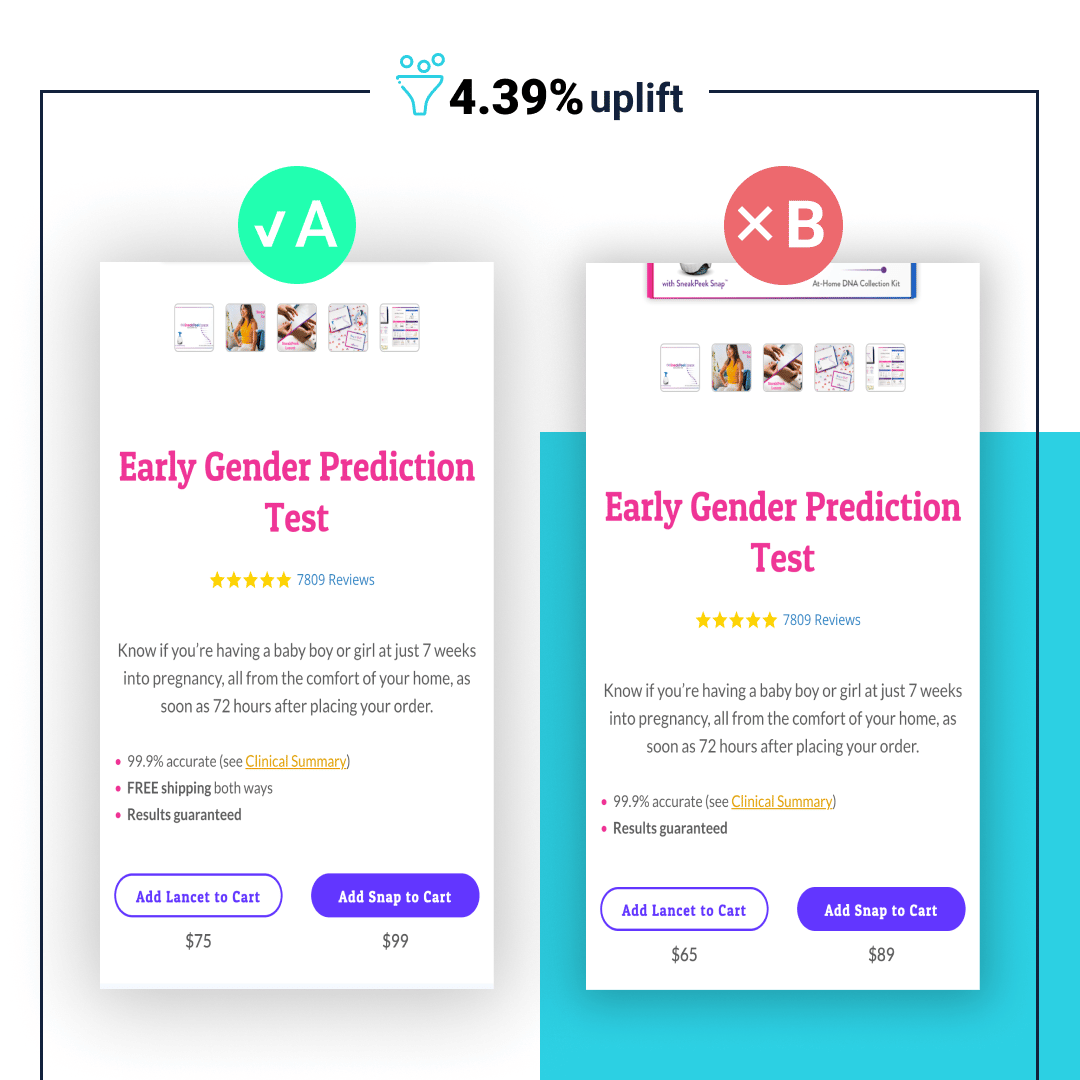
This a/b test idea was different.
Everyone loves free shipping!
That’s why, here, we increased the price of the products by $10, but in return, users are guaranteed free shipping both ways.
This test made a 4.39% increase in conversion rate, which additional revenue.
Adding Product Description Test:
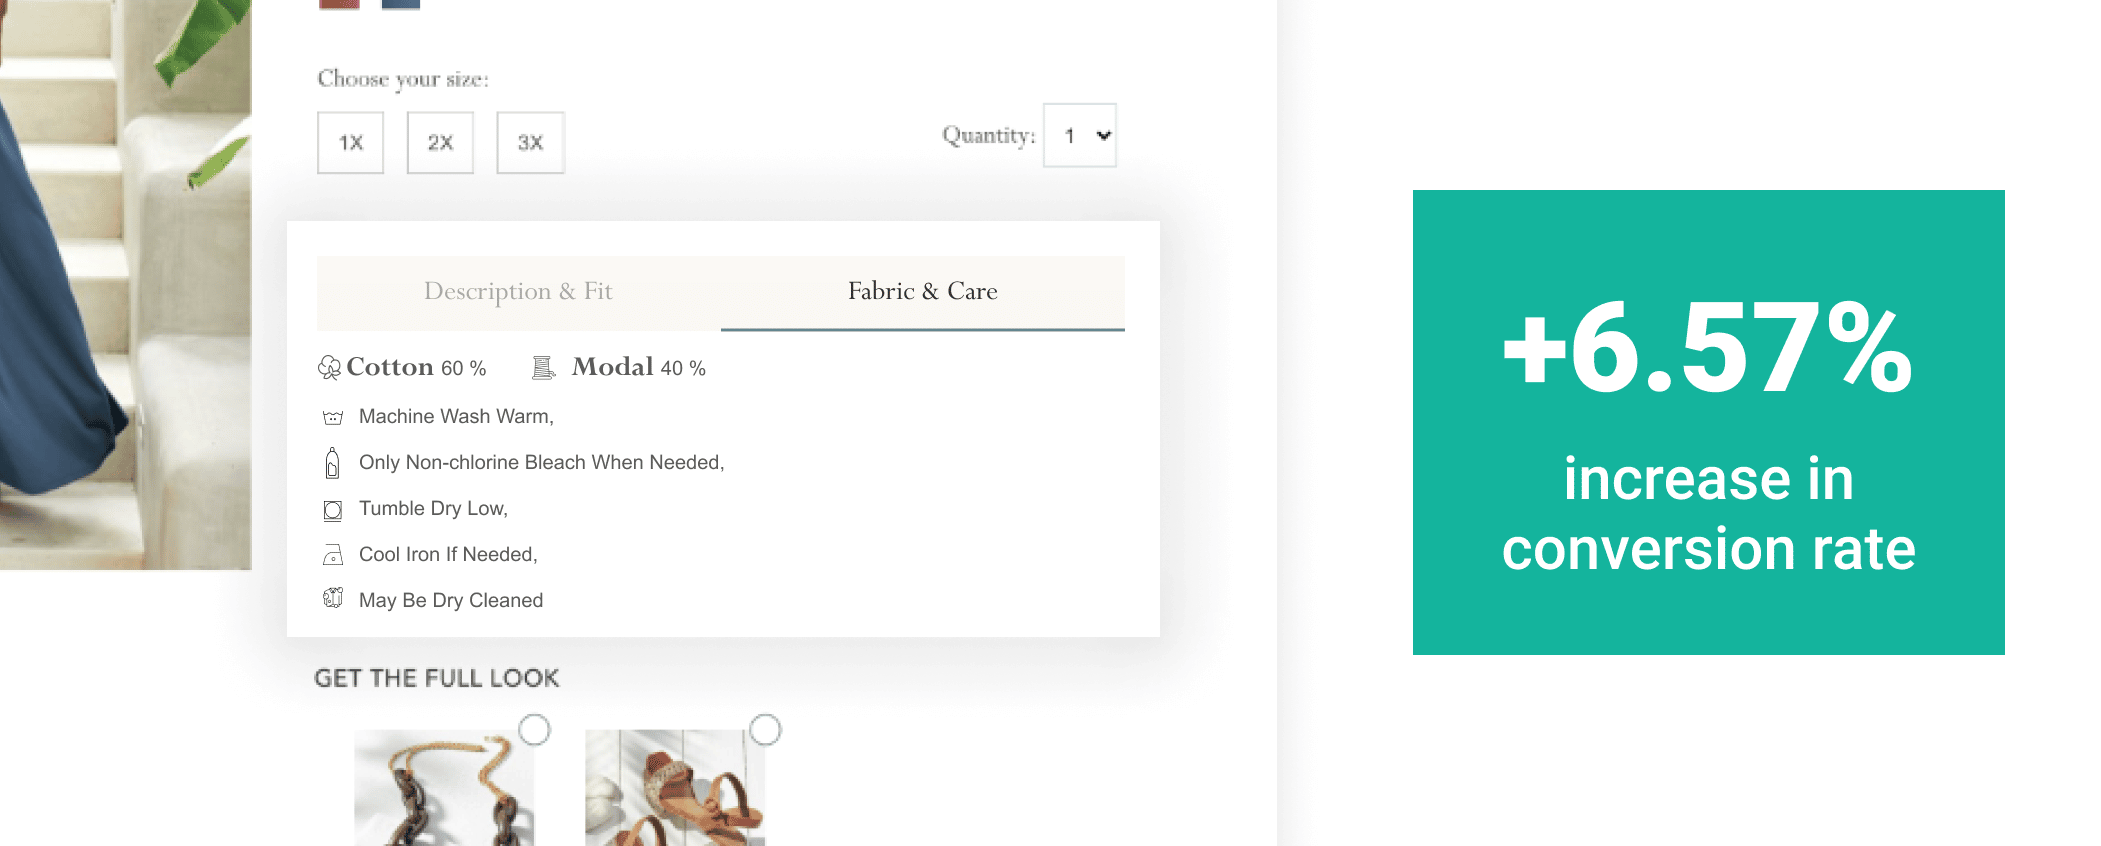
On this website, the old variation had a minimal amount of description and explanation of the product.
And that’s what we did. We added visual elements that included an explanation of the product.
This test caused a 3.87% increase in conversion rate.
Wrapping Things Up:
FigPii Recommendations tool can filter your insights, brainstorm for you, and develop ideas that will take your website to the next level.
It will help convert a massive percentage of your traffic and skyrocket your revenue.