

Have you ever wondered why do your customers shop from you?
Such knowledge is the key to building a successful store!
That’s why FigPii was created in the first place, it’s because Invesp ( conversion optimization platform) needed to get insights from its customers’ websites.
One of the biggest things they rely on is Heatmaps.
Ecommerce heatmaps are a great way to improve your conversion rate and customer experience.
Heatmaps help you figure out what customers like the most, where they click, and which parts of your site they’re most interested in.
This way, you can make some changes and see some improvements!
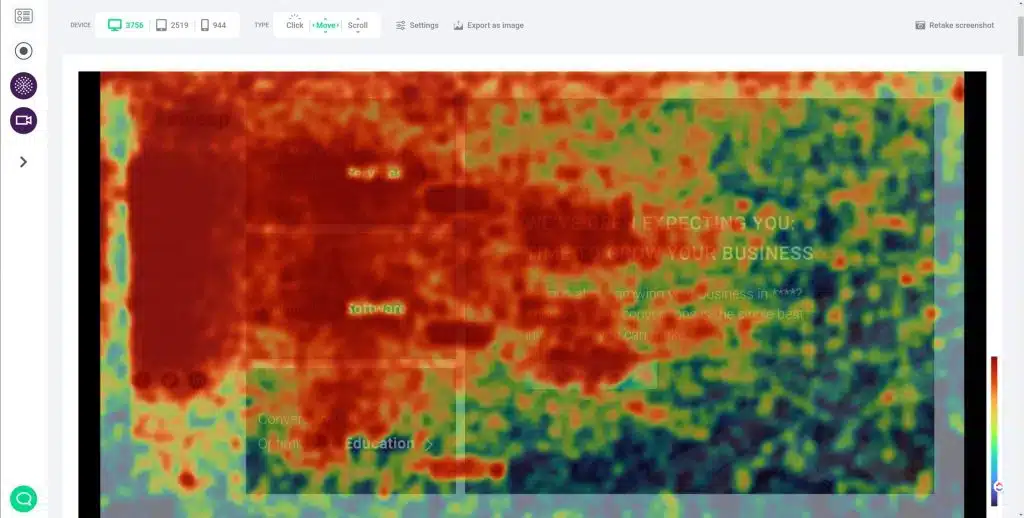
What is a heatmap? It’s a map that shows areas on a website with the highest concentration of clicks or mouse movements.
In other words, heatmaps show visitors’ hot spots.
Let’s go quickly over the main three types of heatmaps.
We wrote a blog about them previously, check it out here.
Heatmaps For Dummies
Color-coded heatmaps are graphical representations of the page overlaid with color. They show you where your visitors interact with your website.
You may also figure out which content or features are most popular among your visitors and how they engage with different parts of your site.
Heatmaps are a great way of getting more insights from your website analytics.
They can tell you more about where people click on your page as well as how many times they’ve clicked there.
This allows you to figure out what they’re looking at and how it fits into the site as a whole. You’ll be able to make educated judgments based on this information that will benefit both visitors and your marketing campaigns.
Types of Heatmaps
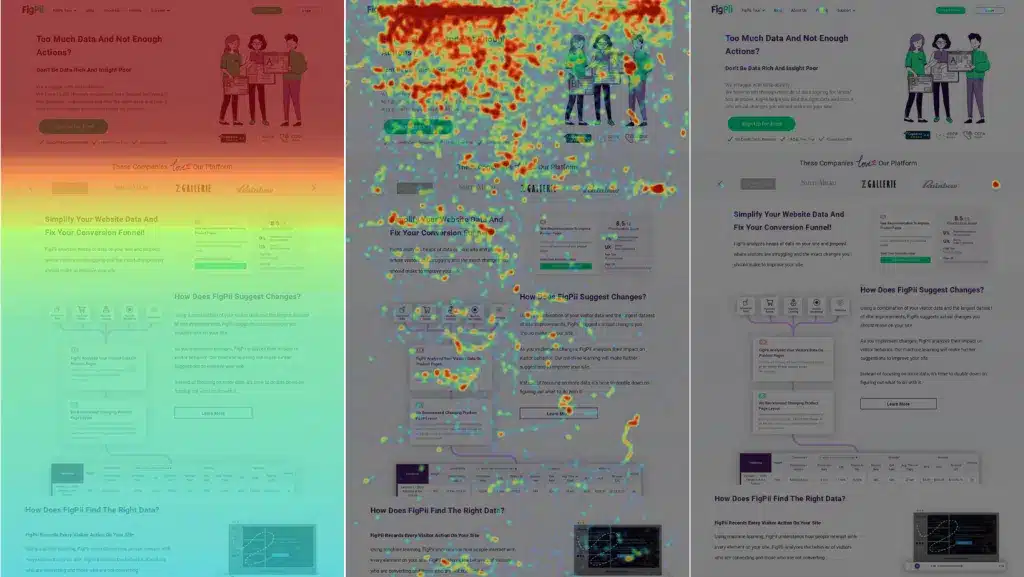
Mainly heatmaps have 3 types; Scroll Maps, Click Maps, and Mouse Move Maps.
Scroll Maps show you how far down the page visitors scroll.
They’re a great way to see if people are reading your content or not. You can also use Scroll Maps to determine which parts of your page need more attention.
For example, if most of your visitors only scroll down to the halfway point of your page, it might be a good idea to add more engaging content near the top.
Click Maps show you where people are clicking on the page. This can help you figure out what’s popular and what isn’t.
It can also help you see how well your calls-to-action (CTAs) are performing. If you notice that no one is clicking on your CTA, then it might
Mouse Move Maps track the mouse movements of visitors. This map type is best used to see how people are moving around the page.
You can use this information to improve your website’s design and layout.
All heatmaps should be considered together as they all provide different data that when pieced together will help you form a more accurate customer profile.
Heatmaps For Dummies: How To Create And Use Them?
Now that you know a little more about heatmaps, let’s go over how to use them.
First, you’ll need to install a heatmap tool on your website. A lot of the popular heatmap tools have free versions as well as paid versions, like FigPii.
Once you’ve installed the tool, it will start tracking the mouse movements and clicks of your visitors.
The data will be collected and then sent to your account so you can view it.
Once you have the data, it’s time to start analyzing it!
You can use it to see which pages and sections of your website are getting the most attention. You can also use it to figure out what content is being ignored by your visitors.
You can also use heatmaps to see how effective your calls-to-action are. If you notice that no one is clicking on your CTA, then you might want to change it.
Overall, heatmaps are a great way to get insights from your website that you wouldn’t be able to get otherwise.
They’re easy to use and can help improve your website’s design, layout, and content.
How To Improve Your Website Experience Based On Heatmap Analytics

One way to improve your website experience is by using heatmaps to determine which areas of your website are getting the most attention.
If you notice that a particular area is getting a lot of clicks, then you might want to add more content or features to that area.
On the other hand, if you notice that an area is being ignored, then you might want to remove it altogether.
heatmaps can also help you figure out which parts of your page are being scrolled past.
If most of your visitors aren’t scrolling down to see your content, then you might want to move it up on the page.
You can also use heatmaps to determine how effective your website’s design is.
If people are having trouble finding what they’re looking for, then you might want to change the layout of your site.
heatmaps are a great tool for determining which areas of your website need more attention.
By using the data from all three types of heatmaps, you can paint a more accurate customer profile that will help you improve your website’s experience.
heatmaps provide valuable insights into how customers interact with your website.
With this data, you can make changes and improvements that help you reach your audience effectively.
Heatmaps can help you figure out what customers like the most, where they click, and which parts of your site they’re most interested in.
This way, you can make some changes and see some improvements to your website conversion rate!
How To Improve Your Ecommerce Store Based On Heatmap Analytics?
Heatmaps can lead to a more enhanced level of customer service as well as better conversions on ecommerce sites.
They provide insight into how your visitors behave online; heatmaps offer statistics on cursor movements, clicks, and scrolling behavior allowing for more effective content curation and design (and less guesswork).
For example, if most of your visitors aren’t scrolling down far enough to see the products, then you might want to move that content up.
You can also use heat maps to determine which calls-to-action have been clicked and how effective they are.
If people aren’t clicking on the CTA’s, then you might want to rework them or change them altogether.
By using heatmaps – along with other data you can create a more informed and accurate customer profile to help you curate and design content more effectively.
Heatmaps can pinpoint which parts of your site get the most attention.
They also indicate what is being ignored, which offers insight into how effective your website’s current layout and design is at grabbing the attention of visitors.
Heatmaps provide valuable insights into how customers interact with your website.
What To Look For When Choosing A Heatmap
If you want to know more about choosing the right heatmap I’d suggest you take a look at a previous blog we wrote “The Best Heat Maps Tool for Your Business: How to Choose One?“
But here’s a quote from it to help you make a decision quickly.
Every platform has its ups and downs, and according to your business need, you need to start gathering information about what exactly do you need.
What I consider the best heat maps tool for my business can be an average one for your business.
Let me give you a real-time example.
Invesp which is a big CRO agency uses FIgPii as the go-to heat maps tool because it offers A/B testing tools, session recordings.
As they look for optimizations and missed conversion opportunities they want a full view from different angles of the website.
Also, they do a lot of A/B testing to improve the conversion rates, so they need all the data to be in on a centralized report at the end of the day.
Or if your site is primarily mobile-friendly then it’s best to go for one of those options that focus on cross-device tracking and heat maps.
In the end, there will be some factors influencing your decision like price point, features offered by the tool, etc.
But in order to make an educated choice about which software is right for you, I recommend going through different reviews before making up your mind.
Reviews can provide much more insight into what each product has to offer than just reading descriptions or visiting their websites alone.
What factors matter when choosing the best heat maps tool?
I’ll speak from my own observation on what makes a heat maps tool great, and what to look for when searching for one.
– The number of heat map reports that are offered.
– Ability to create personal segments and filters for the data gathered on your website
– Variety in visualizing options.
– Integration with other software that you use.
– Free trial period or a lower pricing point if purchasing outright
– Ease of setup, customization, and user experience on the platform.
Conclusion
Heat maps are often used to draw attention to some of the most important elements on a website—but heatmaps don’t just exist for conversion optimizers and marketers.
They can be useful to site designers and UX professionals as well, and they’re only going to become more popular among ecommerce stores that want to improve their website conversions.
And since heatmaps use analytics data that is gathered by various analytic tools like Google Analytics (or others like CrazyEgg), Kissmetrics, etc… it makes heatmaps even more accessible than ever before!
What’s Next?
Now that you know what heat maps are and how they work, you’ll be able to put them into action on your own website and rework your design to increase conversions.