

Everyone wants to drive more valuable traffic to their website.
Everyone wants their website to have more and more conversions.
But that can be mission impossible if the website is not optimized for conversions.
So, how then do you go about optimizing a website for conversions?
Well, there are dozens of CRO processes that you can follow. Although the processes may differ, they all rely on tools to help get the job done.
These CRO tools come in different categories, and they all save a specific purpose in the optimization process.
This article is the first post of a series about different conversion rate optimization (CRO) tools you need in your toolbox. Since this is the first edition, we will highlight different categories of CRO tools and then take a deep dive into Web Analytic Tools.
But, before we jump into the topic of the day, it is essential to mention that no CRO tool will help you outperform your competitors – they probably have access to the same tools you’re using.
An efficient CRO strategy is what will help you outperform your competitors.
Types of CRO Tools
Although there are thousands of CRO tools in the market, they all fall under three categories:
- Web Analytics tools
- User Behavior tools
- CRO Testing tools
- Web Analytics Tools: These tools help you understand what is going on on your website in terms of numbers.
- User Behavior Tools: Unlike analytics tools, user behavior tools collect qualitative data. This means they show you how users behave or interact with your website.
- A/B Testing Tools: They are used after one has already used Web Analytics Tools and the User Behavior Tools. An A/B testing tool helps you compare the changes done on your website and determine if the change increases or decreases the conversions.
Now that you understand the different categories of CRO tools, it’s now time to take a deep dive into what you can do with web analytics tools.
Using Web Analytics Tools In CRO
Web Analytics tools are critical in conversion optimization. Without this type of tool, you can’t find answers to questions like:
- How many people are visiting your website?
- Where are they coming from?
- What exactly are they doing on your website?
- Which devices are users accessing your website with?
- Which kind of traffic has the highest conversion rate?
- Which web pages are visitors landing on first? And which landing pages are users turning away from?
- Are visitors going beyond your home page and going to other landing pages?
– Without answers to the above, you can forget about boosting your site conversions.
If you have a little knowledge of web analytics tools, you’d know that it is pretty easy to feel overwhelmed and drown in the amount of data and reports in most of those tools.
So, what kind of metrics should you focus on in web analytics tools?
Bounce Rate
Bounce Rate is when the user who has visited your website leaves in just three seconds or less. Visitors bounce on websites for various reasons, and these include:
- When page loading time is slow.
- When the wrong audience lands on your web page due to misleading title tags and meta descriptions.
- When the website content is low quality. This may be because:
- Headings aren’t optimized with main keywords.
- Phrases are short.
- Internal linking needs to be improved.
- Call-to-actions aren’t enticing enough.
Not all bounce rates are an indication of a problem.
For instance, a high bounce rate on pages like Contact and Thank You pages is not an indication of a problem.
But a high bounce rate on pages you expect visitors to be converting is a red flag.
With that said, it’s reasonable to say that analytic tools can help show you pages on your website that are leaking conversions.
Interactions Per Visit
Interactions Per Visit metric helps you measure visitors’ actions within their visits, whether viewing a new page, commenting on a blog, adding to cart, etc.
It gives you an idea of how many interactions visitors make on your site on a single visit.
These interactions will help you understand user behavior and improve the conversion rate.
Value Per Visit
Value per visit is a metric that helps you understand how much value you are getting out of visitors.
Here’s how you can calculate it: the number of total visits / the total value created.
Here’s an example, when visitors navigate through your blog, they create value whenever they add a page view.
Also, they will create value when they comment on your website.
Cost Per Conversion
Cost Per Conversion referred to as “Post Per Referral or “Lead Generation Costs,” is a website metric used to measure over time.
It helps you understand how much you are paying for each Conversion.
When you are trying to increase conversion rates on your website, you will need to keep the cost per Conversion in mind.
Why?
Sometimes, your net income can be negative with a high cost per conversion rate.
This means that you are spending more to convert customers than you make.
That’s why you need to put the “Post Per Conversion” as a must.
Examples of Web Analytics Tools
There are many analytics tools out there. However, here we will mention three well-known ones, which are:
- Google Analytics.
- Adobe Analytics.
- Heap Analytics.
Google Analytics

What is Google Analytics?
Google Analytics is a free website tracking platform that provides statistics and essential analytical tools.
It can track data like:
- How many users land on a website?
- How do they interact with the website’s content?
- How many of the website’s visitors convert?
And other things.
Advantages of Google Analytics
Google Analytics has many pros like:
- It is ideal for start-ups/small businesses that use the G-suite software because it connects with all other tools used to integrate the company.
- It is a free analytics tool, where the free version is apt for small companies, but Analytics 360 is for larger organizations.
- It lets the user create customized reports in the dashboard with the metrics of their choice. A user can configure custom reports of their own and also save them to use repeatedly.
- It provides real-time sessional data of the website with regular data refresh.
- The Conversion Tracking feature helps immensely in changing/ improving layout design.
- It provides comprehensive details of the users’ activity on the site.
- It has an insight feature that allows you to ask “human questions” to the system and extrapolate the insight from your data.
Disadvantages of Google Analytics
As for the cons:
- The UI is not the most intuitive, and it can be a challenge to find what you need if you aren’t familiar with the system.
- The enormity of information available in the dashboard makes data analysis and processing easy for a power user who has some knowledge in crunching numbers.
- There are many technical coding aspects necessary to integrate, which could be difficult for business owners who mainly use GA for their business email.
- It takes a lot of time to pull out data, even on system reports. This becomes critical when analyzing a data set or trying to troubleshoot a problem.
Google Analytics Integrations
Google Analytics can integrate with:
- Google Ads
- Google Data Studio
- Salesforce Marketing Cloud
- Google AdSense
- Google Optimize 360
- Google Search Ads 360
- Google Display & Video 360
- Google Ad Manager
- Google Search Console
- 3DCart
- 3PL Central
- 4Castplus
- Accelo
- ACT-ON
- Amazon
- BigCommerce
- Banking
- Bronto
- DRIFT
- EBAY
- FRESHWORKS CRM
And much more. You can find more integrations here.
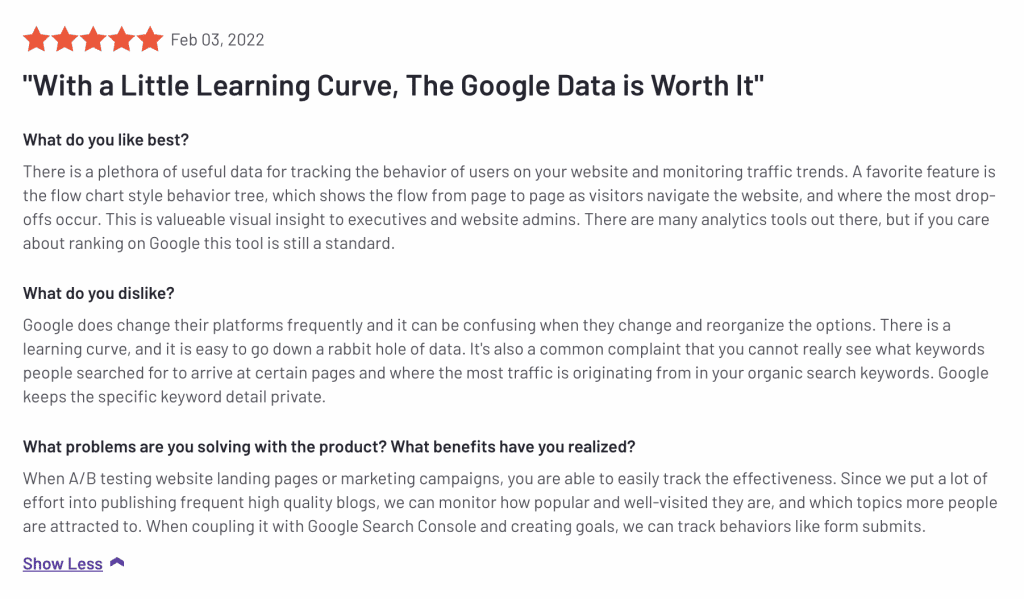
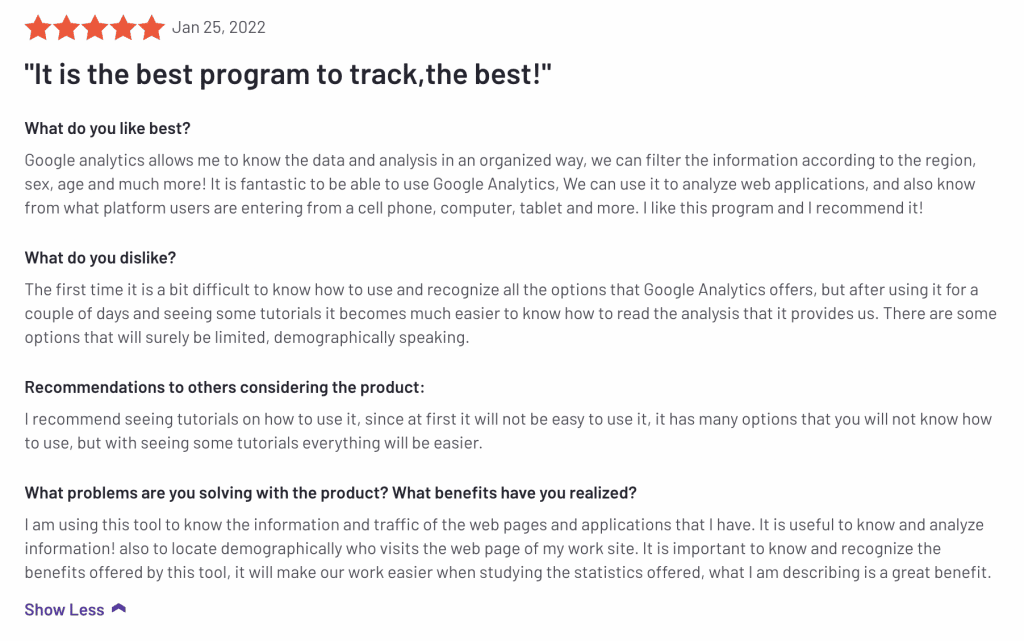
Google Analytics Customer Reviews
Here are some of the customer reviews according to G2:
Adobe Analytics
What is Adobe Analytics?
Adobe Analytics is part of the Adobe Cloud suite.
It offers features like:
- Multichannel Data Collection
- Intelligent Alerts
- Tag Management
- Offline Data Integration
- Anomaly Detection
- Cross-Device Analytics
- Advanced Segmentation
- Advanced Calculated Metrics
- Third-Party Integrations
- Shared Audiences
Advantages of Adobe Analytics
As for the pros of Adobe Analytics, here are some of them:
- Adobe Analytics is suited for enterprises where you can efficiently perform data analysis, mixing, and matching from anywhere in the customer journey with you.
- It provides reporting with versatility features, and most of them are above its predictive intelligence.
- It provides real-time access to website performance throughout the entire digital experience.
- Adobe Workspace allows you to build easy-to-consume dashboards/reports for end-users.
- Adobe Analytics enables landing page traffic measurement. Example metrics: sessions, page views, and visitors.
- It also integrates an option that works as anomaly detection and helps you determine and understand all abnormal activity within our website.
Disadvantages of Adobe Analytics
As for the cons:
- UX-wise, free form tables become challenging when many columns are added, which are sometimes necessary.
- It requires Excel Adobe Report Builder for more advanced segmentation instead of being available in the platform.
- The lack of adding annotation and notes to graphs – makes it harder for the end-user to understand dips in data.
Adobe Analytics Integrations
Adobe Analytics can integrate with:
- Hootsuite
- Invoca
- Branch.io
- BrightEdge
- AB Tasty
- Searchmetrics Suite
- SessionCam
- OneHydra
- Ektron Web Content Management System (Discontinued)
- Part of Episerver
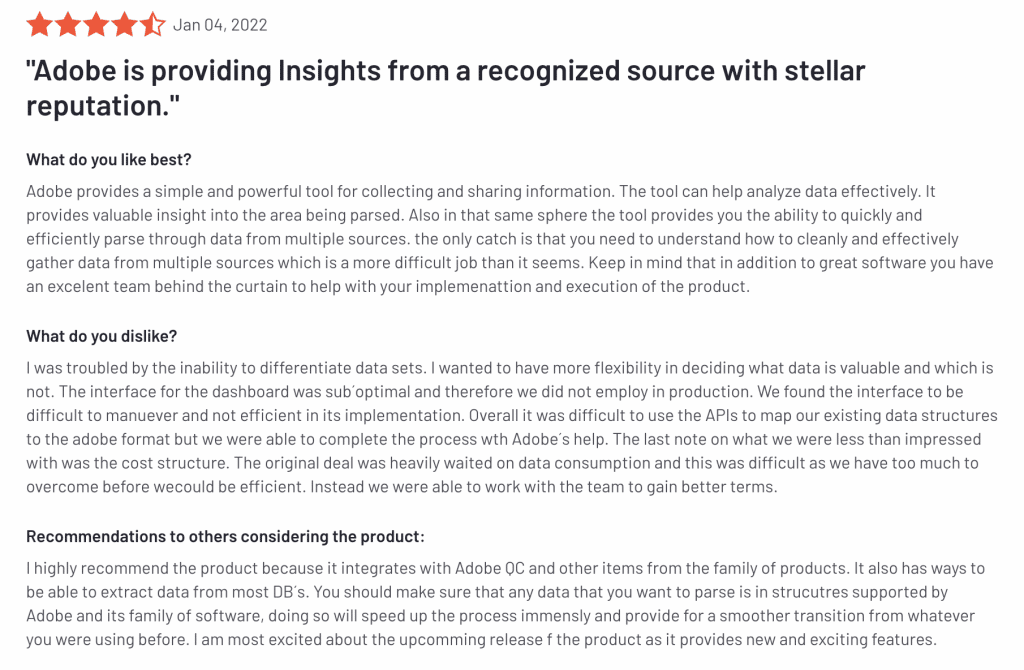
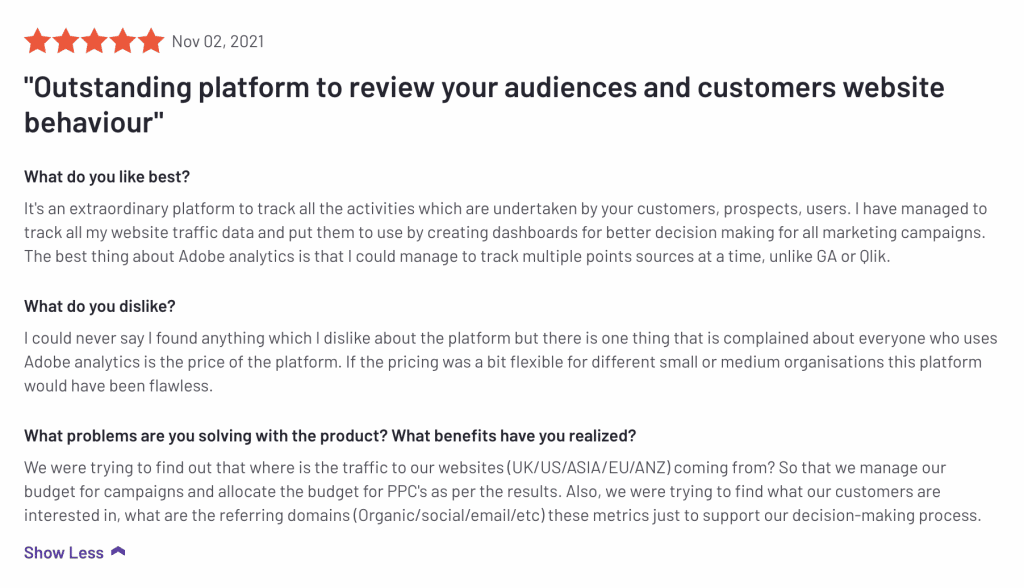
Adobe Analytics Customer Reviews
Here are some of the customer reviews according to G2:
Heap Analytics
What is Heap Analytics?
Heap was founded in 2012, is a web analytics tool that helps you capture user action on your website, including:
- Clicks
- Taps
- Swipes
- Pageviews
- Form submissions
Advantages of Heap Analytics
Heap Analytics has many pros like:
- It allows you to see in real-time what your clients are doing.
- It has a fast and robust data collection and processing system that considers every specific detail related to the web.
- HHeap’sevent visualizer makes it possible to have the robust analytics that every product manager wants without bothering and disturbing their dev team.
- It enables you to save all data historically. If you forget to define an event, you can do so later and still look at it historically.
- It captures insights well regarding the way users are interacting with third-party applications.
- It helps you understand which features are under or over-utilized among our product offerings on iOS, web browsers, and mobile browsers.
Disadvantages of Heap Analytics
As for the cons:
- Path report does not allow users to see typical paths between a starting point and an ending point.
- Graph report – when comparing multiple events, the UI does not allow filtering for each event.
- The configuration is not easy for new users, and it takes a little time to get familiar with this tool and start taking advantage of its many benefits.
- Race conditions – Heap gets confused when multiple events work around the same time.
Heap Analytics Integrations
Heap Analytics can integrate with:
- Appcues
- Shopify
- Redshift
- S3
- Intercom
- Salesforce
- Clearbit
- Zapier
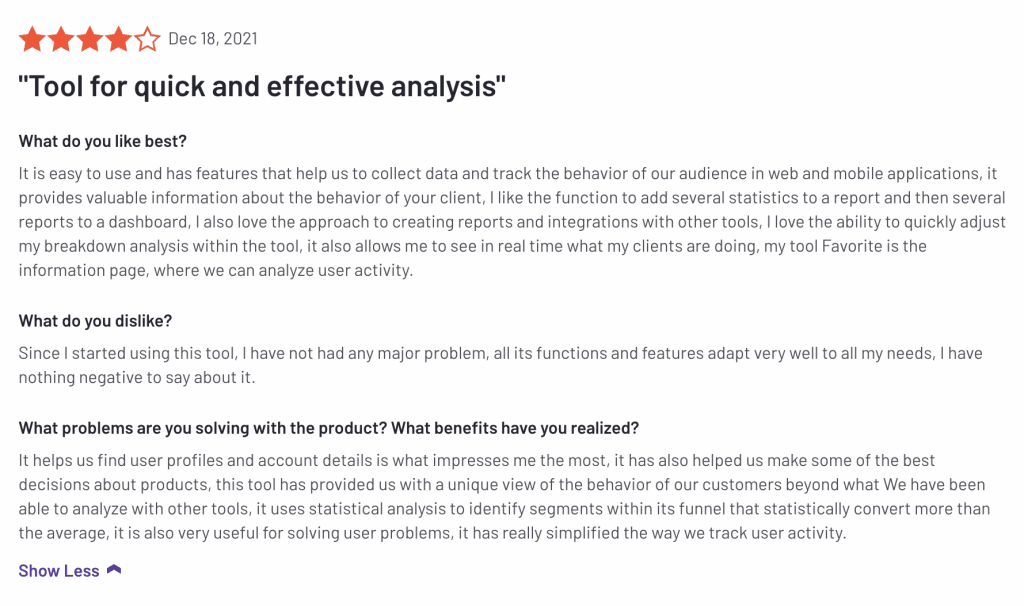
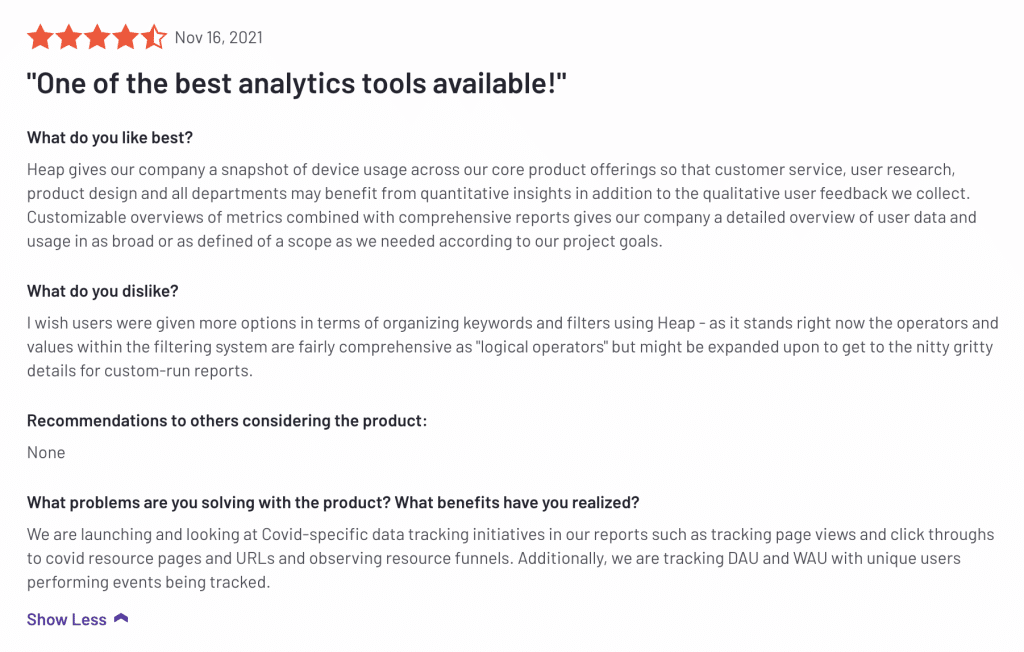
Heap Analytics Customer Reviews
Here are some of the customer reviews according to G2:
Wrapping Things Up
That’s it for the first blog of this series.
I hope it was as beneficial as I hoped it to be.
The next one will be about the second type of CRO tool: User Behavior tools.