- What is a Website Heatmap?
- How To Create And Set Up A Heatmap using FigPii
- Sign in to your FigPii account to access the Dashboard
- Create New Heatmap
- Name Your Heatmap
- Selecting the Number of Views
- Selecting Device and Visitor Types
- Targeting Specific Pages
- Using Advanced Targeting Options
- Saving and Activating the Heatmap
- What Does Your Heatmap Look Like After Collecting Data?
- Conclusion

Join Our Journey To $100K in Monthly Revenue.
Subscribe to Invesp's blog feed for future articles delivered to your feed reader or receive weekly updates by email.Understanding what your website visitors do when they land on your pages is key to improving their experience. While metrics like page views and bounce rates provide a big-picture overview, they often miss the finer details.
Heatmaps fill that gap by visually showing where users click, how far they scroll, and which areas of the page they tend to ignore. Many businesses start by using
free heat map software
to test their site’s user engagement before moving to advanced tools.
Originally, heatmaps were used in scientific fields to track data patterns. Over time, they became a powerful tool for website analysis, helping site owners see where users interact and where they are losing interest.
So, why does this matter? Once you know where your visitors are engaging (or not), you can make smart decisions about tweaking your design, moving around content, or rethinking your entire layout. The result? A more user-friendly website and, ultimately, better conversions.
This guide will walk you through creating and setting up a heatmap using FigPii.
What is a Website Heatmap?
A website heatmap is a tool that visually represents how users interact with different elements on your webpage. It uses color to show where visitors click, scroll, or hover, making it easier to see which parts of your site are getting attention and which areas are being overlooked.
Think of it as a weather map for your website, but instead of showing temperatures, it highlights user behavior.
Warmer colors like red and yellow indicate areas with lots of engagement, while cooler colors like blue and green point to areas with less interaction.
There are different types of heatmaps you can use, depending on what you want to learn:
- Click Heatmaps:
These show where visitors click the most on a page. This is great for understanding which links, buttons, or images get the most attention.
- Scroll Heatmaps:
These track how far down the page visitors scroll. You can quickly see if important content is missed because users aren’t scrolling far enough.\
- Move/Mouse Heatmaps:
These record where users move their mouse across the screen. Since people tend to follow their eye movement with the mouse, this gives you an idea of which parts of the page are catching their attention.

How To Create And Set Up A Heatmap using FigPii
Setting up a heatmap in FigPii is simple and straightforward. Whether you’re new to heatmaps or have experience with other tools, FigPii makes it easy to start tracking user interactions in just a few clicks.
-
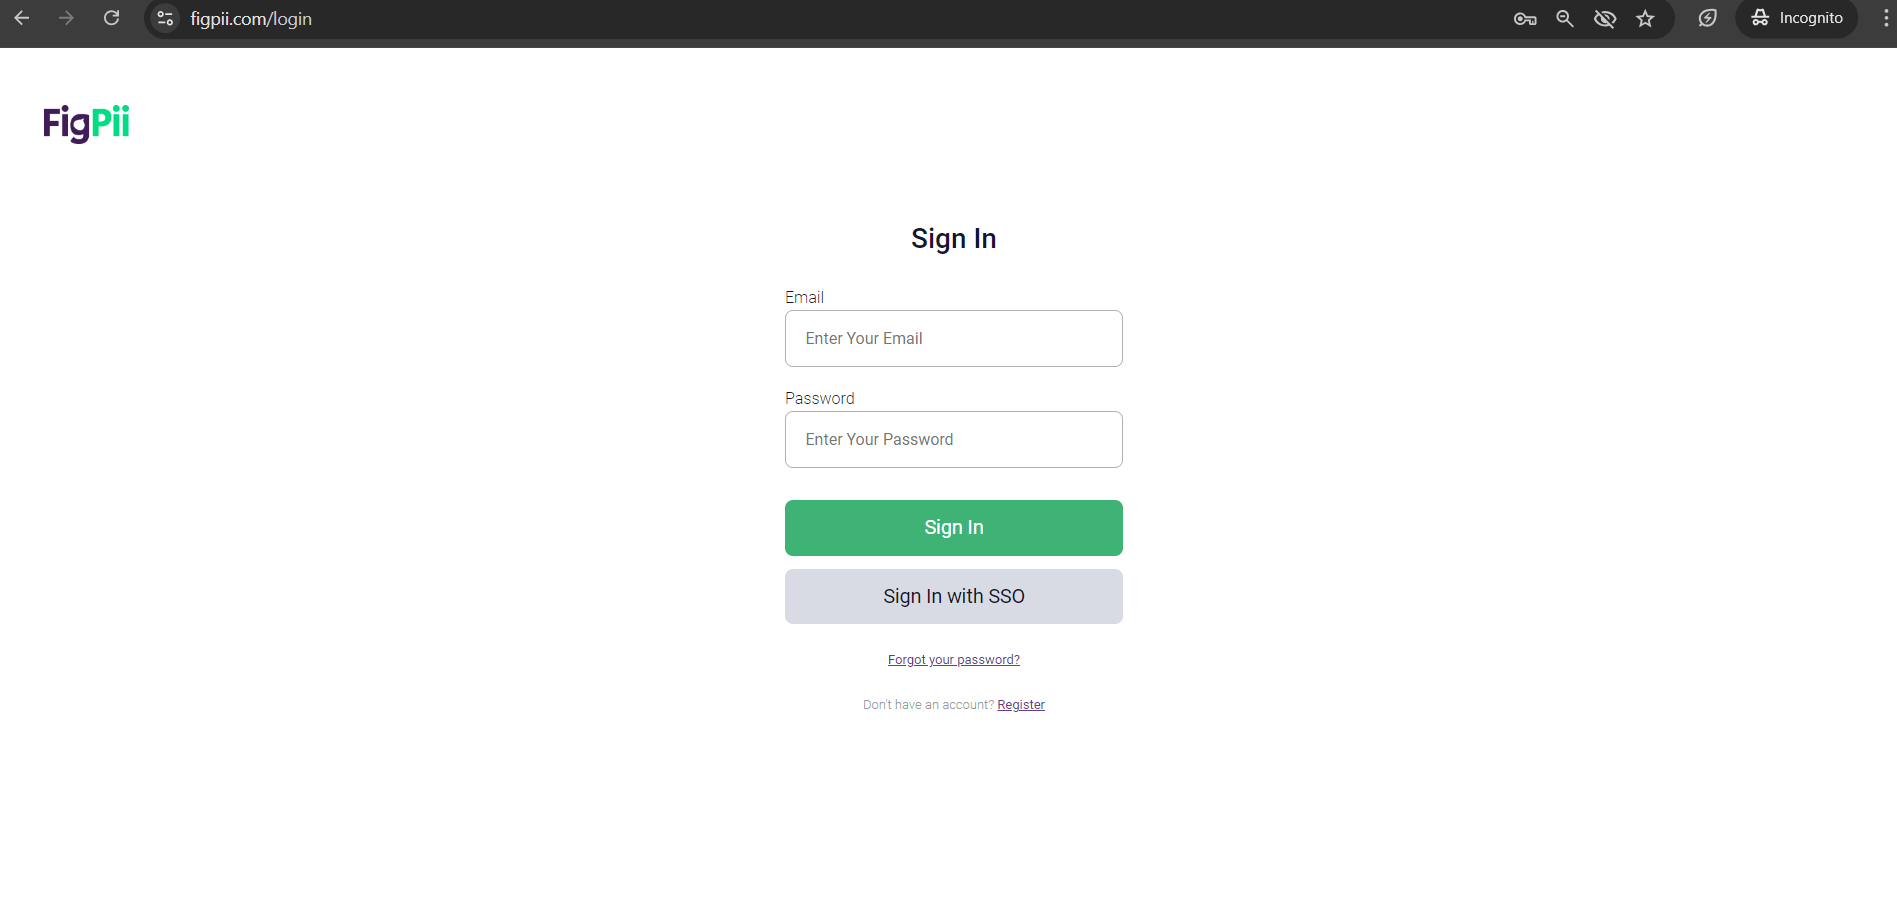
Sign in to your FigPii account to access the Dashboard
You’ll land on the dashboard once logged into your FigPii account.
From the left sidebar, navigate to the “Heatmaps” section.
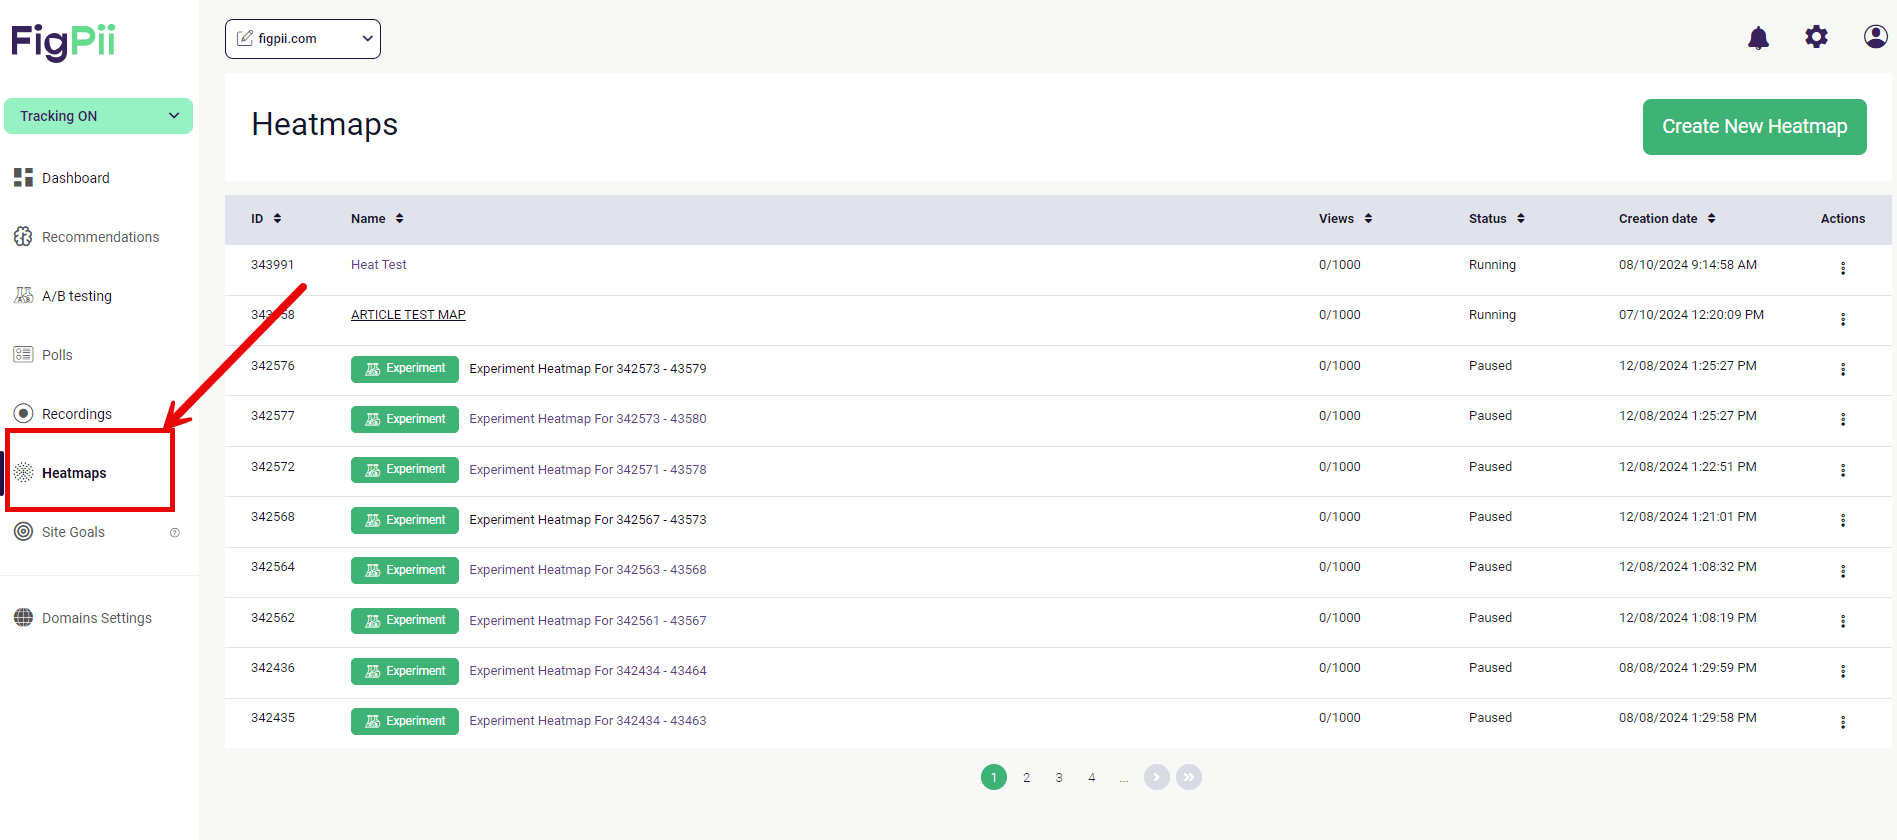
Once created, this is where all your heat maps will be displayed. This menu also offers options for A/B testing, polls, and recordings, but we’ll stick with heat maps for now.
-
Create New Heatmap
In the Heatmaps section, look for the
Create New Heatmap
button at the top right. Clicking this button will start the process of setting up a new heatmap.
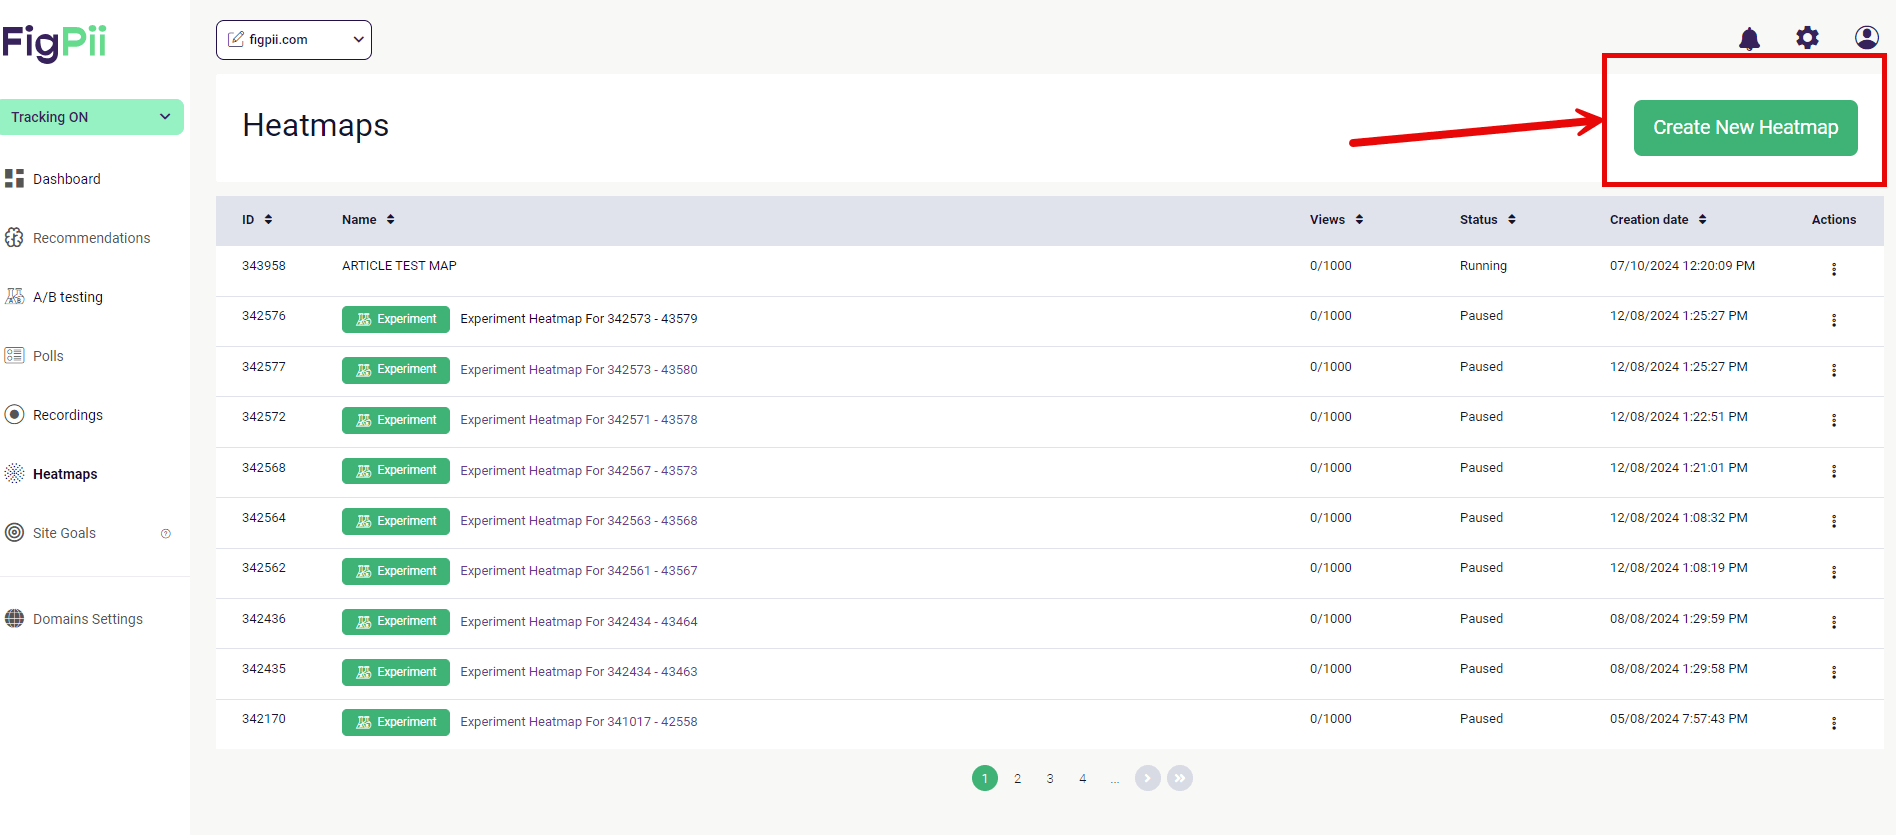
This brings you to the configuration screen, where you’ll begin defining the details of your heatmap.
-
Name Your Heatmap
The first thing you’ll do is give your heatmap a name. This is important, especially if you’re going to create multiple heatmaps for different pages or campaigns.
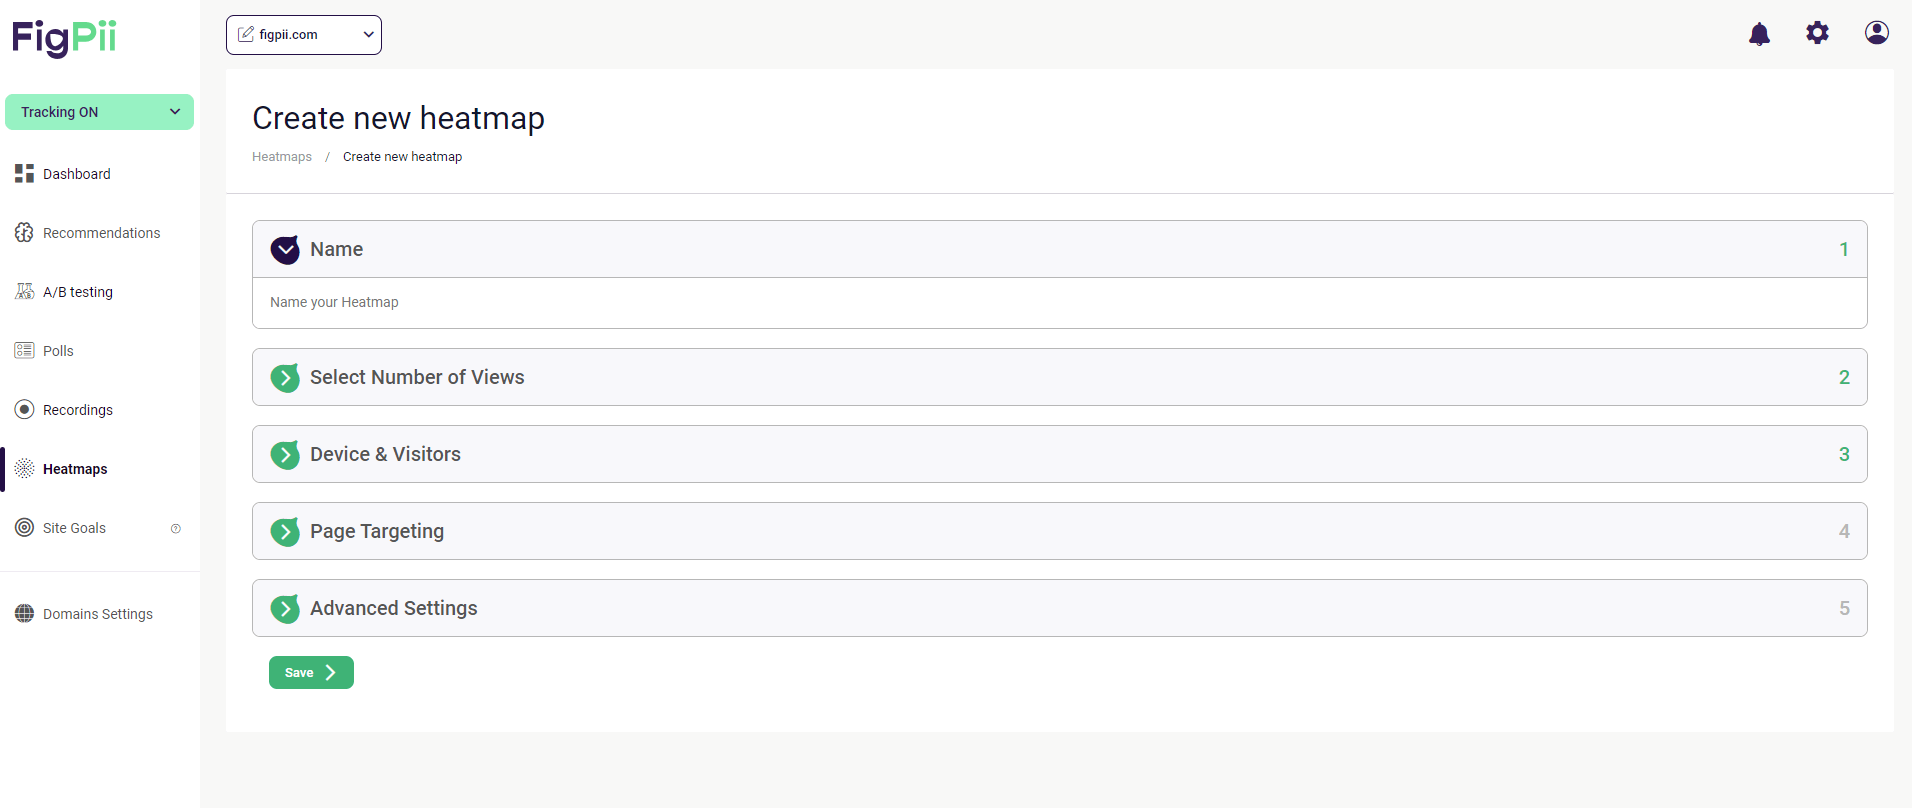
A clear and descriptive name makes it easy to identify your heat maps later. For example, a name like “Product Page—Click Map” works well if you track clicks on a product page.
-
Selecting the Number of Views
Next, you’ll choose how many views you want to track. This setting determines how much data the heatmap will collect before it stops gathering information.
For smaller sites or specific campaigns, 1,000 views might be enough. If your site gets more traffic, you might want to go for 5,000 or more to get a more accurate picture of user behavior.
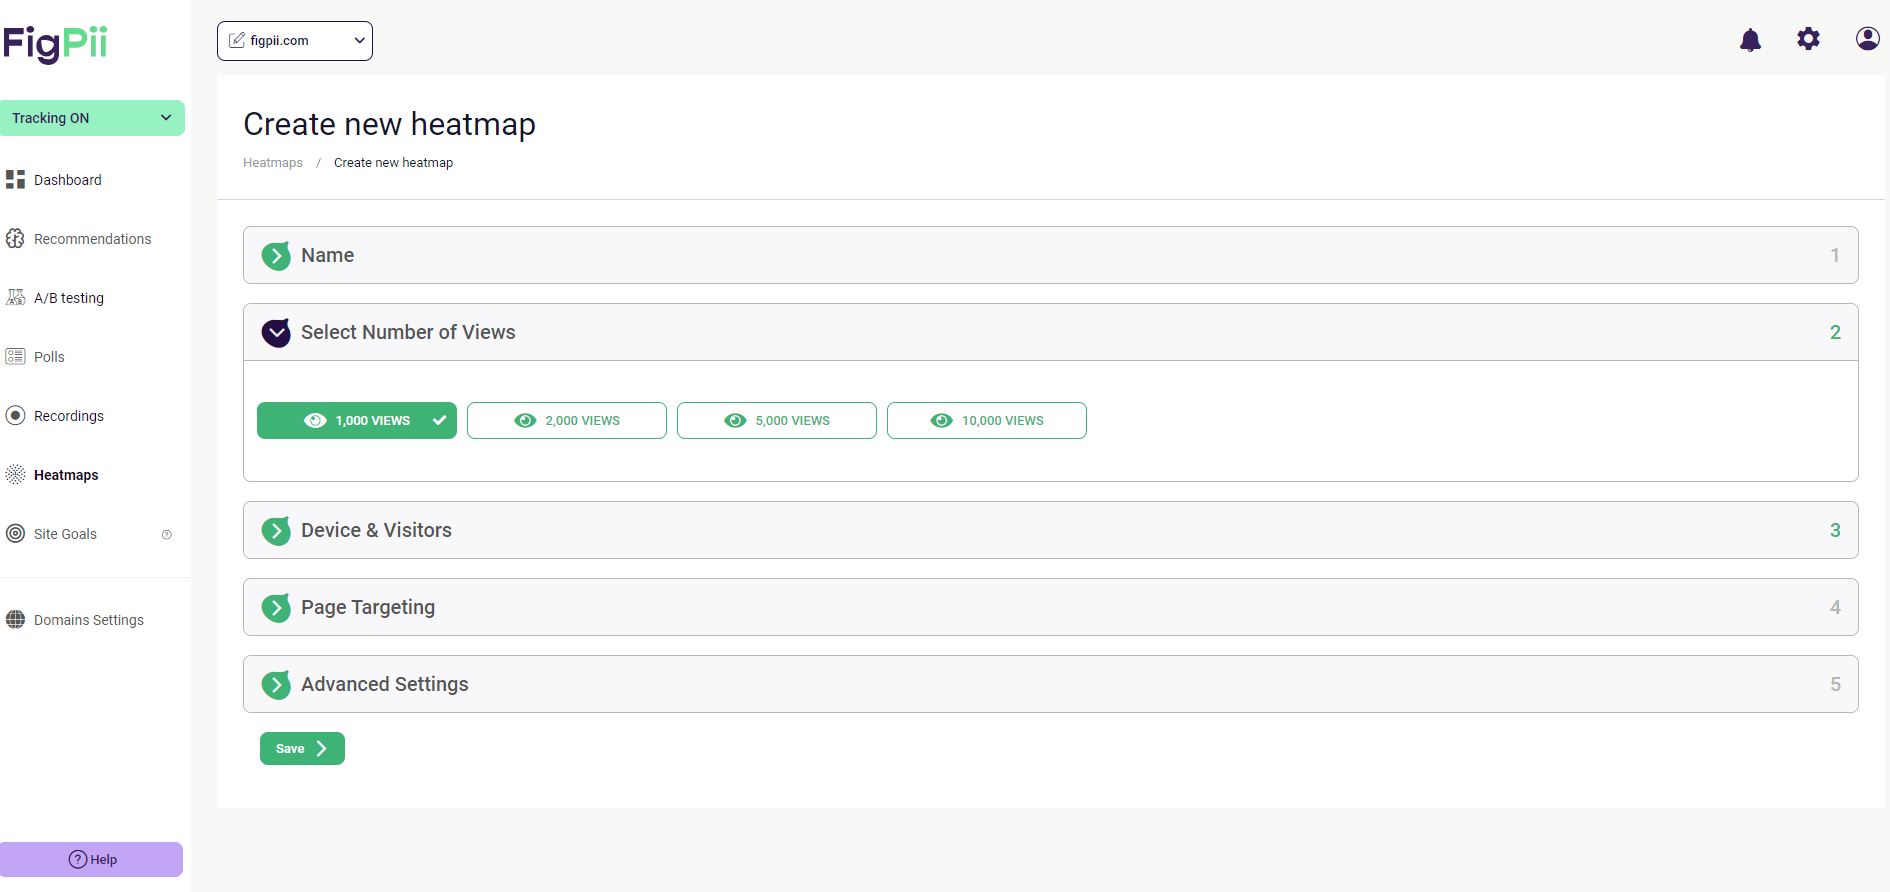
Choosing a number of views that fits your traffic size is good. If you set it too low, you might miss out on important data, but setting it too high could give you more data than you need for analysis.
-
Selecting Device and Visitor Types
After naming your heatmap and selecting the number of views, the next step is deciding which devices and visitor types you want to track. This ensures that the data you collect is specific to your audience and their behaviors.
FigPii allows you to choose between different devices and types of visitors. You can track interactions on mobile devices, desktop devices, or both.
This is especially useful if your website has a responsive design, as user behavior may differ depending on their device.
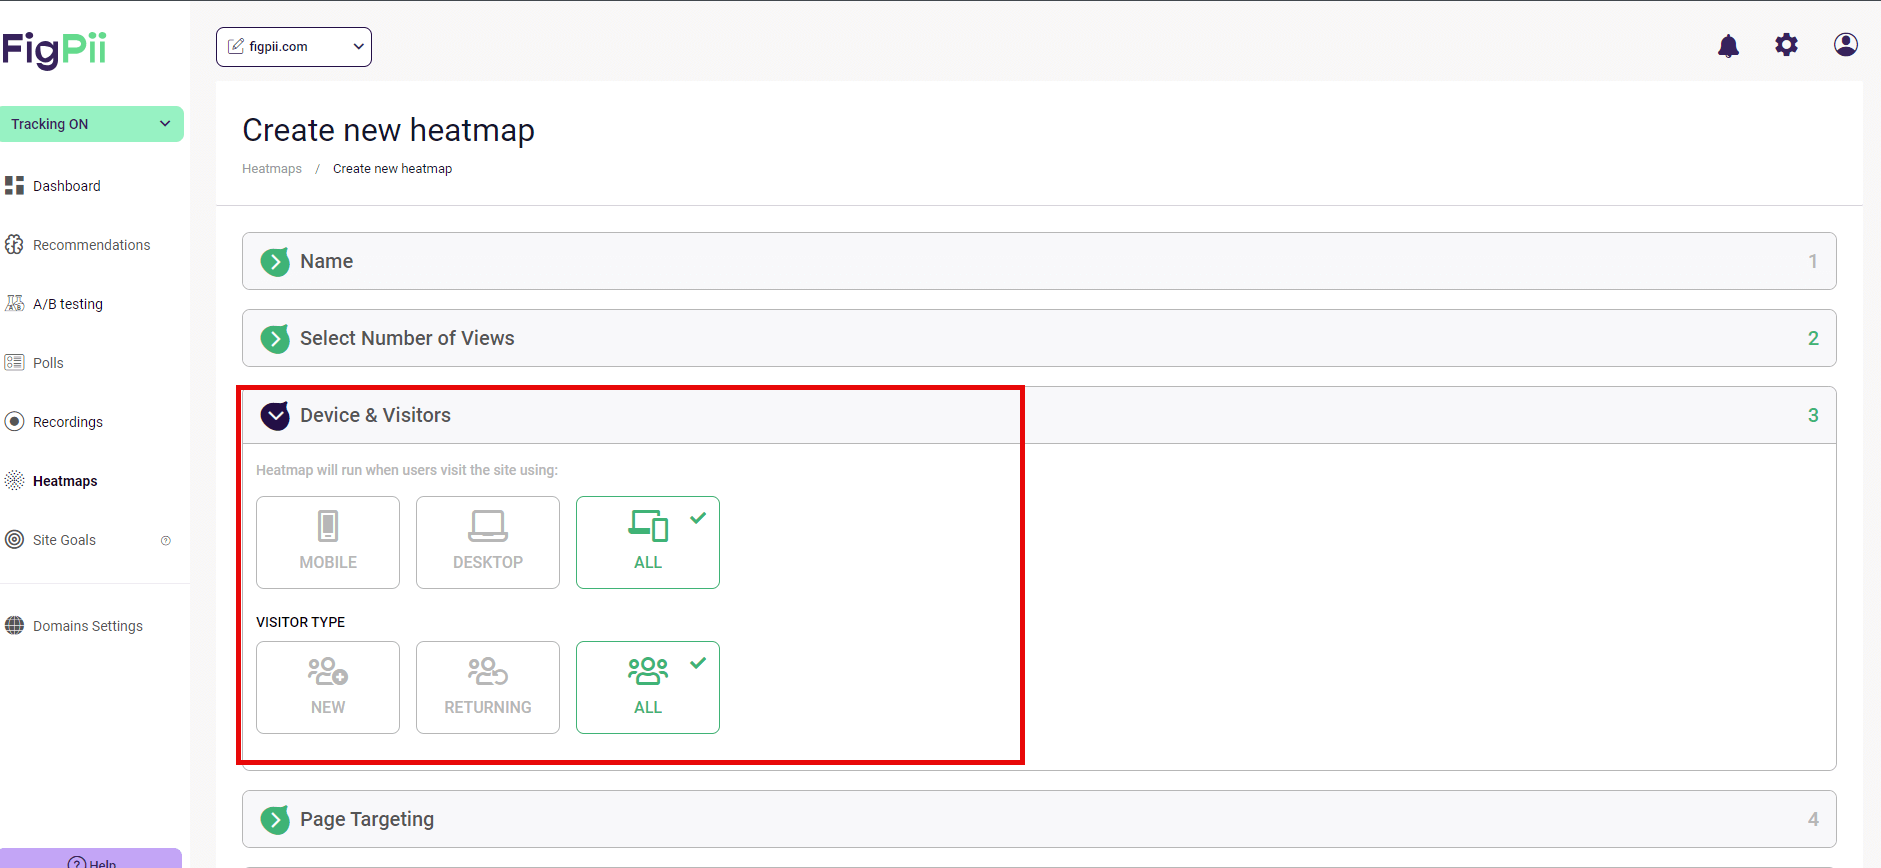
For instance, mobile users might interact more with certain buttons or features that desktop users overlook. By selecting mobile and desktop, you can get a complete view of how visitors engage with your site across different platforms.
You can also track new visitors, returning visitors, or all visitors. If you’re running an A/B test or campaign targeted at first-time visitors, selecting “New” can give you data specific to that group.
On the other hand, selecting “Returning” will show how your repeat visitors interact, which could highlight different behaviors from loyal users. Selecting “All” gives you a broader overview and is a good option if you want to track both types of visitors at once.
-
Targeting Specific Pages
Now that you’ve selected the device and visitor types, it’s time to focus on which pages you want to track with your heatmap. FigPii allows you to target individual pages or groups of pages, giving you flexibility based on your website’s structure and goals.
Page targeting lets you decide exactly where your heatmap will track user interactions. This is especially helpful if you’re interested in seeing how visitors behave on a specific landing page, product page, or even an entire section of your site.
You have two main options for targeting:
- Simple Targeting:
This is the best option if you want to track a single page or a small number of specific URLs.
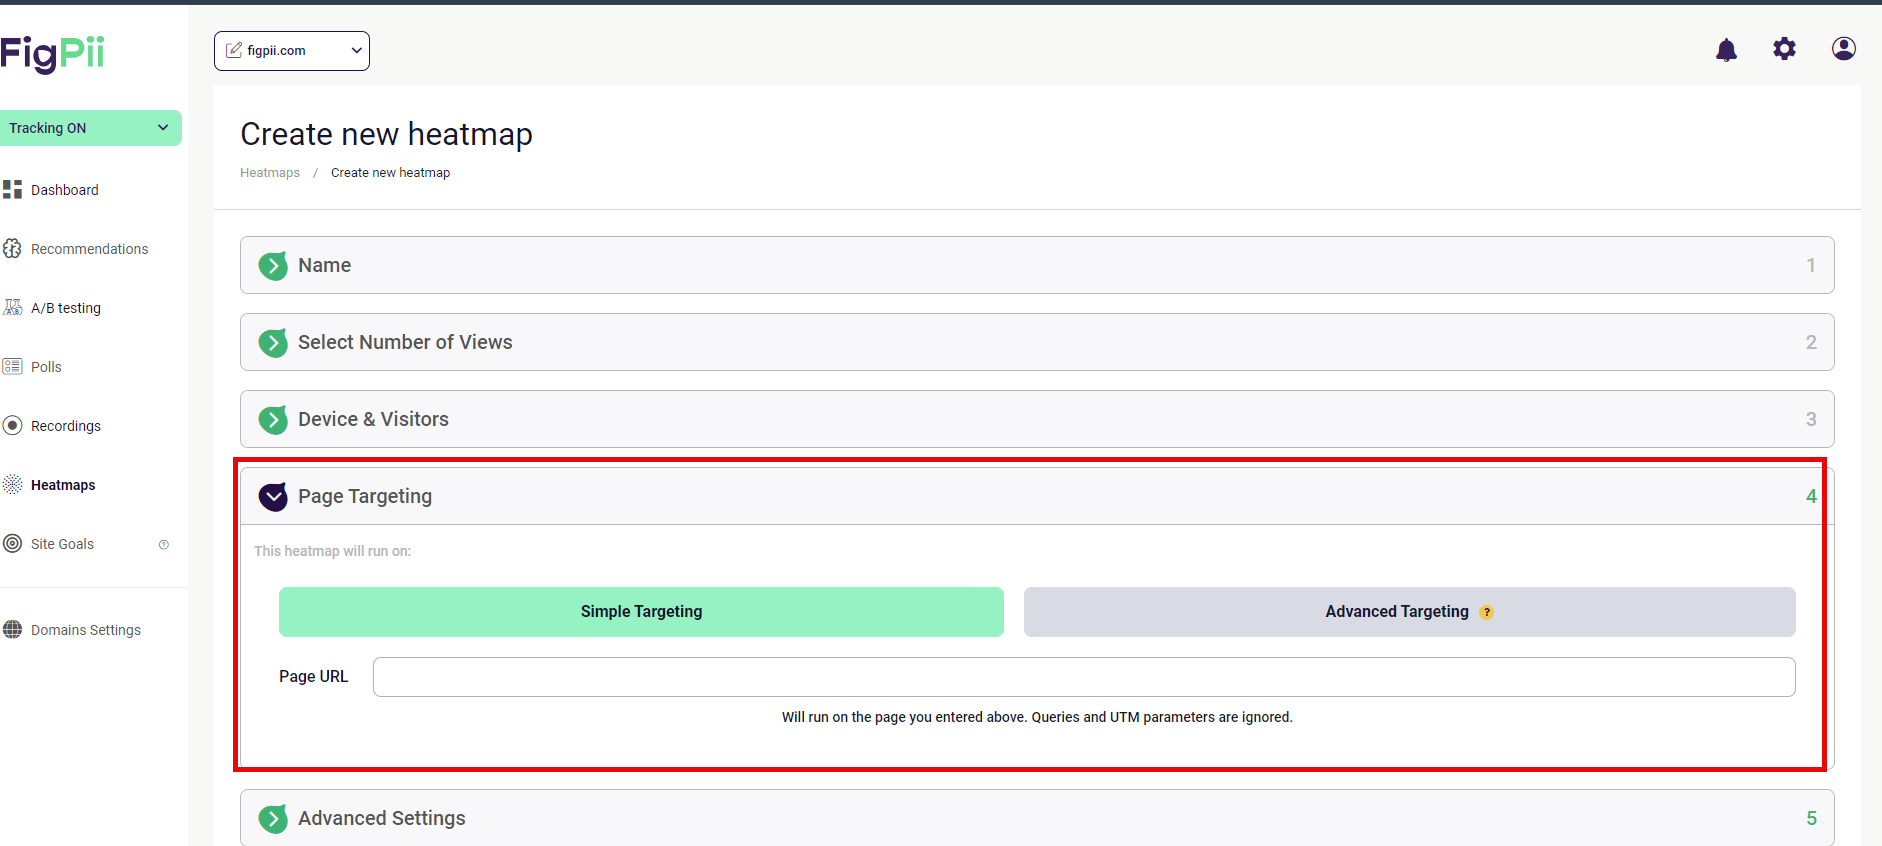
You just need to enter the exact page URL where you want the heatmap to run. Simple targeting is ideal for campaigns or individual page analysis.
- Advanced Targeting
allows you to work with more complex rules, such as tracking multiple pages with similar URL structures.
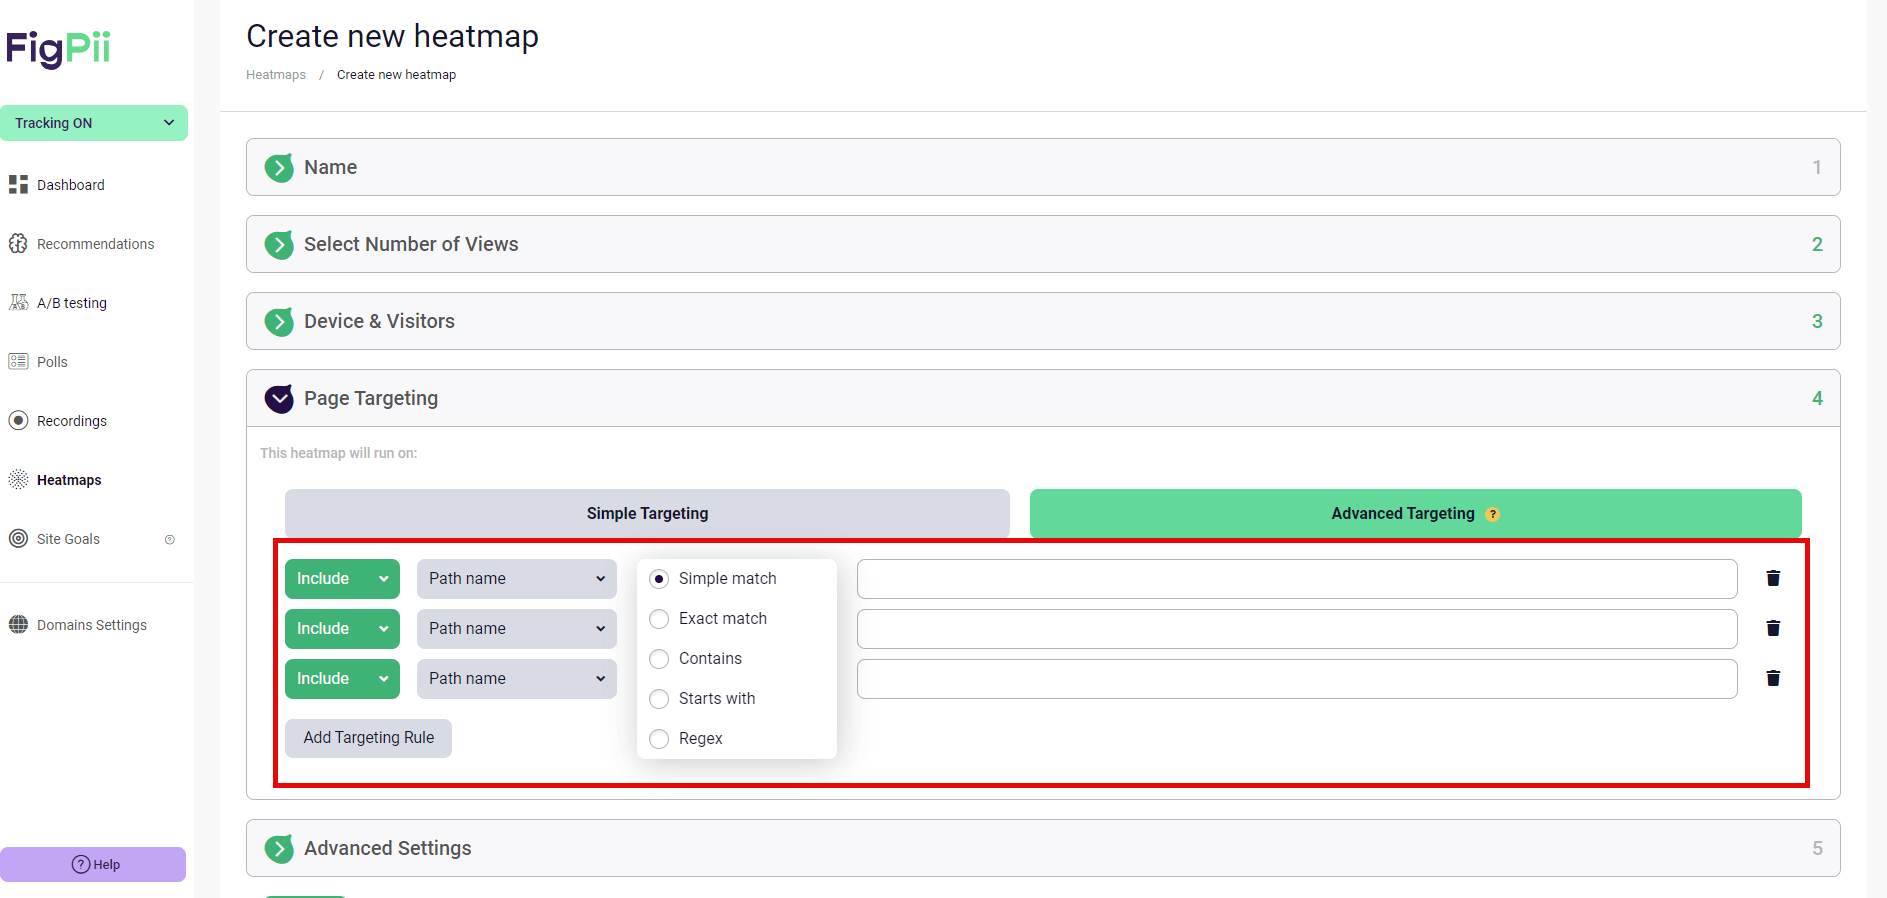
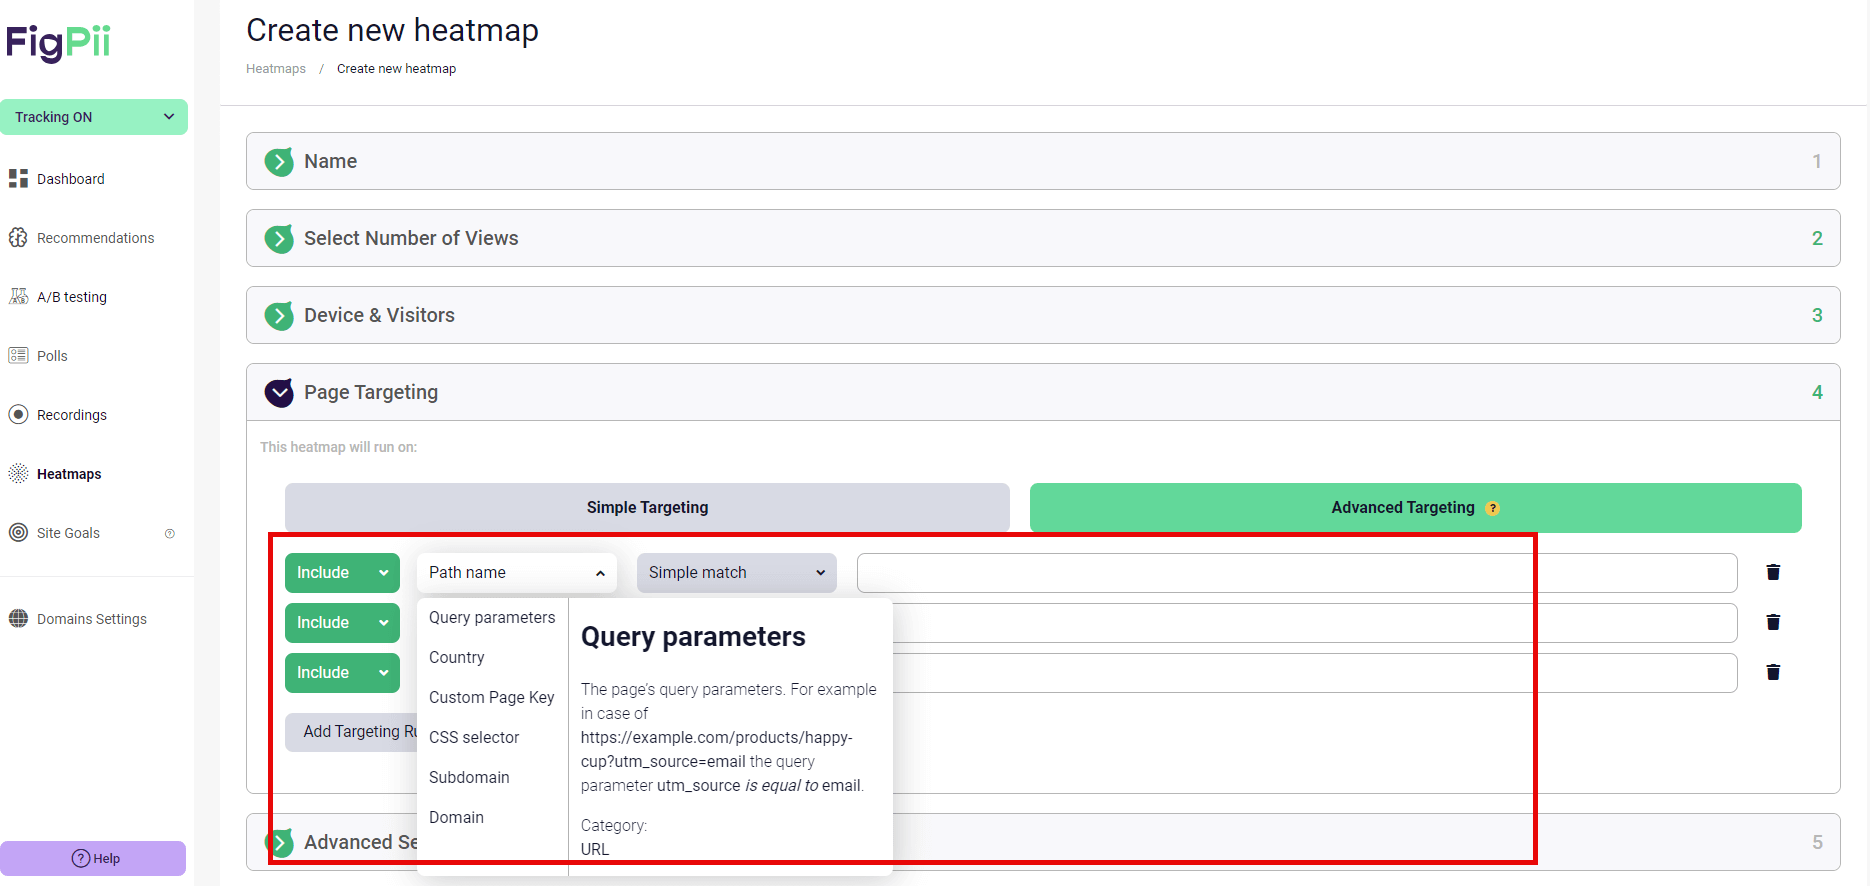
You can target pages based on:
- Path Name Targeting:
This option allows you to track all pages that contain a particular path in the URL. For example, if you want to track all blog posts, you can target URLs that include “/blog/” in the path. This way, you can apply the same heatmap across multiple pages without setting up individual heatmaps for each one.
- Query Parameter Targeting:
If your site uses query parameters (like ?utm_source or ? ref) to differentiate campaigns or user actions, you can use these to target your heatmaps. For example, you might want to see how users from a specific ad campaign interact with your page by tracking URLs with matching UTM parameters.
- Subdomain Targeting:
If your website has multiple subdomains (for example, support.yourwebsite.com or blog.yourwebsite.com), you can set the heatmap to track only certain subdomains. This is useful if you’re running separate sites for different purposes but want heatmap data only from one specific area.
- CSS Selector Targeting:
For sites with dynamic content or complex layouts, you can use CSS selectors to target specific elements on the page. This allows you to track user interactions with particular buttons, forms, or other elements, regardless of where they appear on the page.
This flexibility allows you to focus your analysis on the areas of your website that matter most to your business goals.
To understand more about how page targeting works in FigPii, you can check out the knowledge base.
-
Using Advanced Targeting Options
Once you’ve configured your heatmap settings, you should review the final options before making your heatmap live.
This step includes optional advanced settings that can refine your data collection based on your needs.
FigPii offers a few extra features to help you fine-tune your heatmap setup. While these are optional, they can be useful depending on your website’s structure or tracking goals.
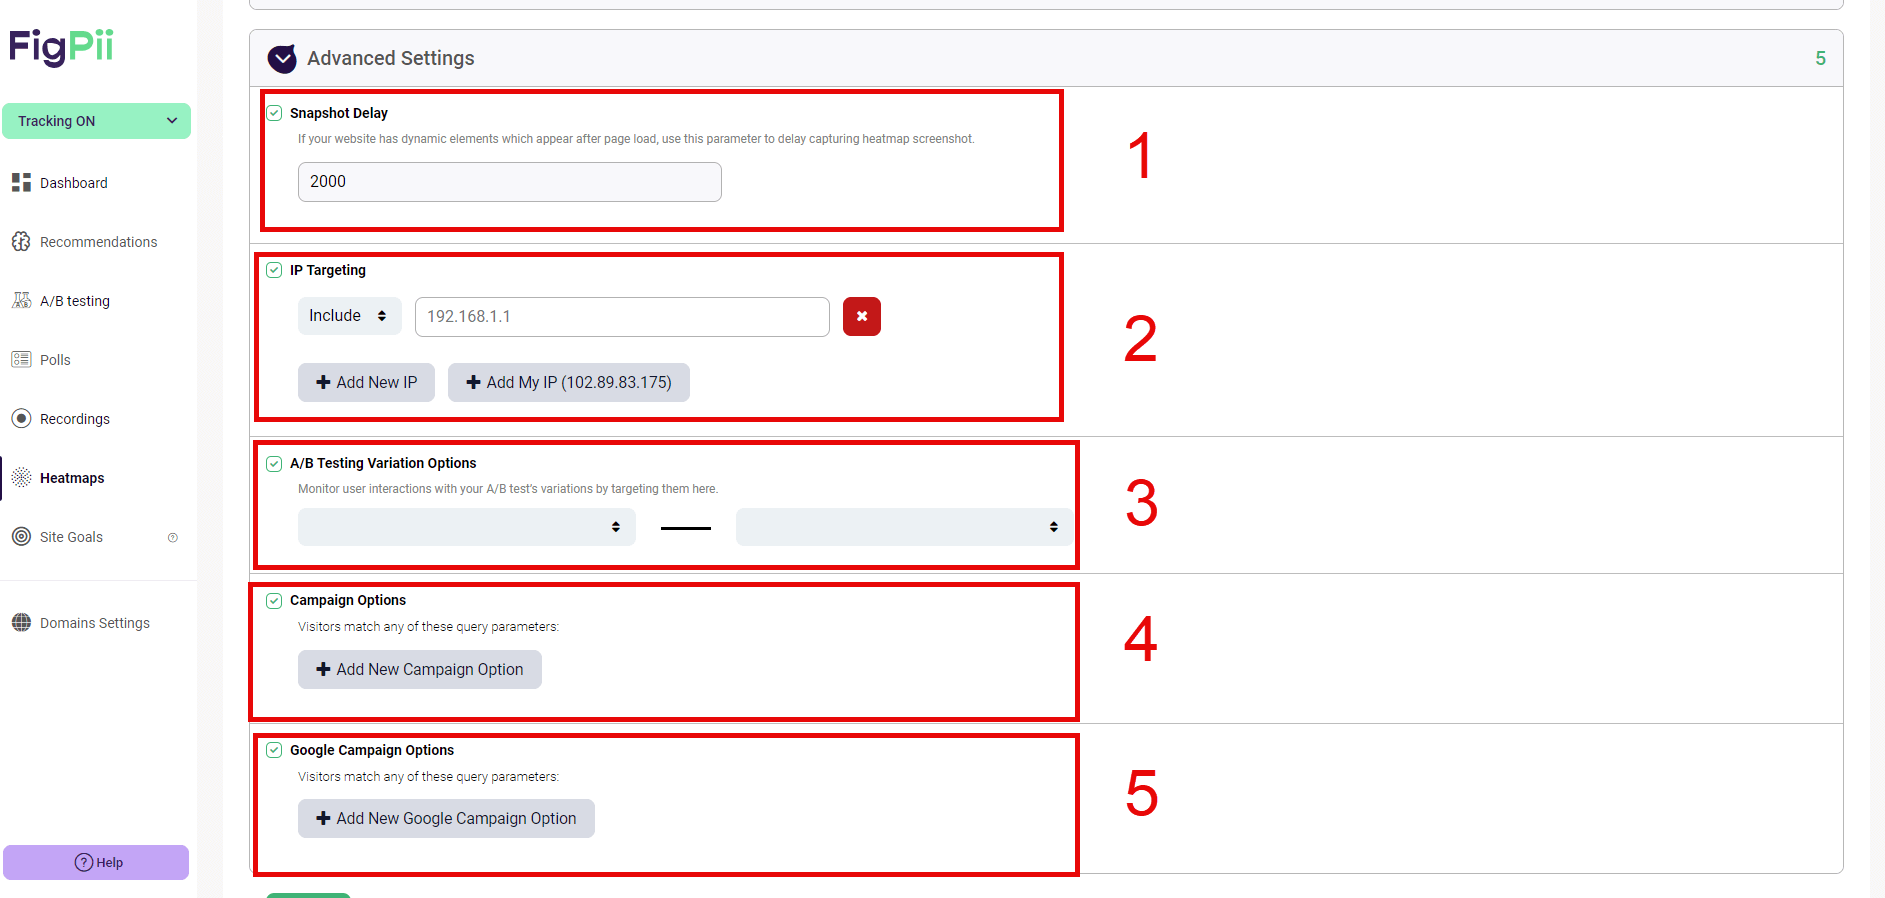
- Snapshot Delay:
If your site has dynamic elements (like images or content that load a few seconds after the page is displayed), setting a snapshot delay ensures that the heatmap captures the page once everything has loaded. You can adjust this based on your website’s load time, ensuring the data you collect accurately reflects the user experience.
- IP Targeting:
This option allows you to include or exclude specific IP addresses from your heatmap. For instance, if you don’t want your internal team or office traffic skewing the results, you can add your IP address here to exclude it from tracking.
- A/B Testing Variation Tracking:
If you’re running A/B tests on your website, FigPii’s heatmaps can track user interactions across different test variations. You can set up heatmaps for specific page versions to compare users’ engagement with different designs or layouts.
- Campaign Tracking:
If you’re running marketing campaigns that use query parameters like UTM codes, you can target those specifically to see how visitors from different sources interact with your site. For instance, tracking only visitors from a paid ad campaign can help you measure its effectiveness.
- Google Campaign Tracking:
Similar to campaign tracking, you can use this setting to focus on visitors from Google campaigns, tracking interactions based on UTM parameters. This gives you insights into how your Google Ads traffic behaves compared to organic traffic or other channels.
-
Saving and Activating the Heatmap
Once you’re happy with all your settings, it’s time to save and activate your heatmap. Click the “Save” button, and your heatmap will start tracking interactions on the selected pages according to your set parameters.
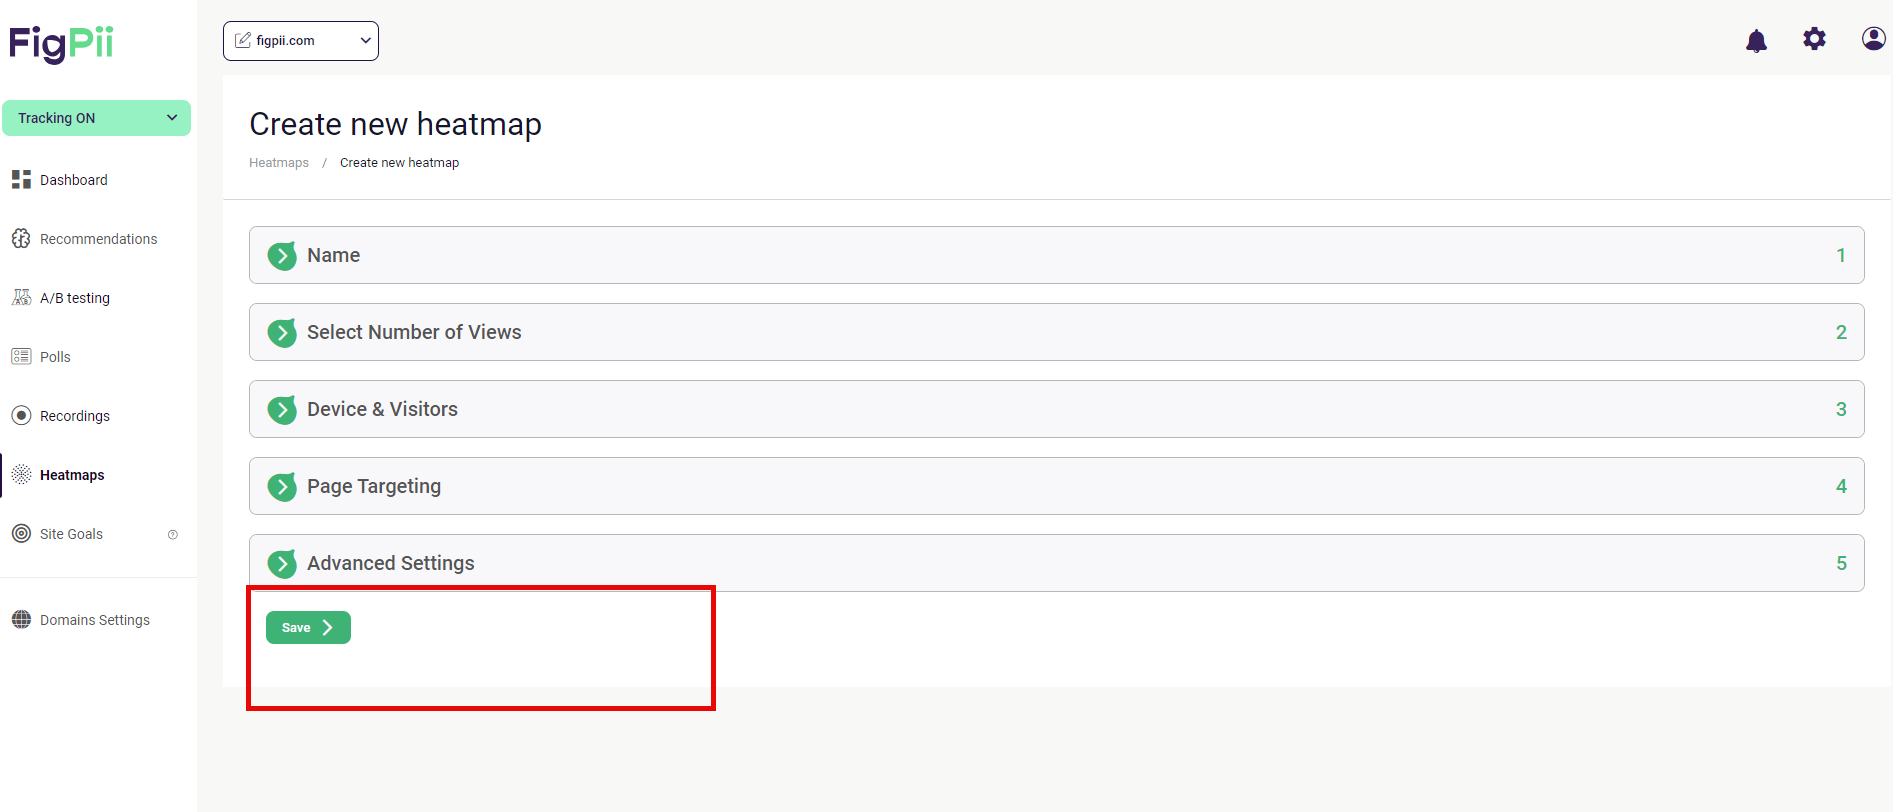
From this point, FigPii will begin gathering data based on user behavior. You can always revisit this heatmap to pause, edit, or adjust settings.
Invesp TV

Bounce Rate in Google Analytics 4

Top Google Optimize Alternatives
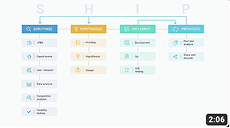
Conversion Rate Optimization Mastery Course: SHIP Process by Invesp
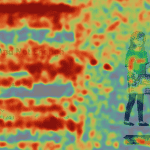
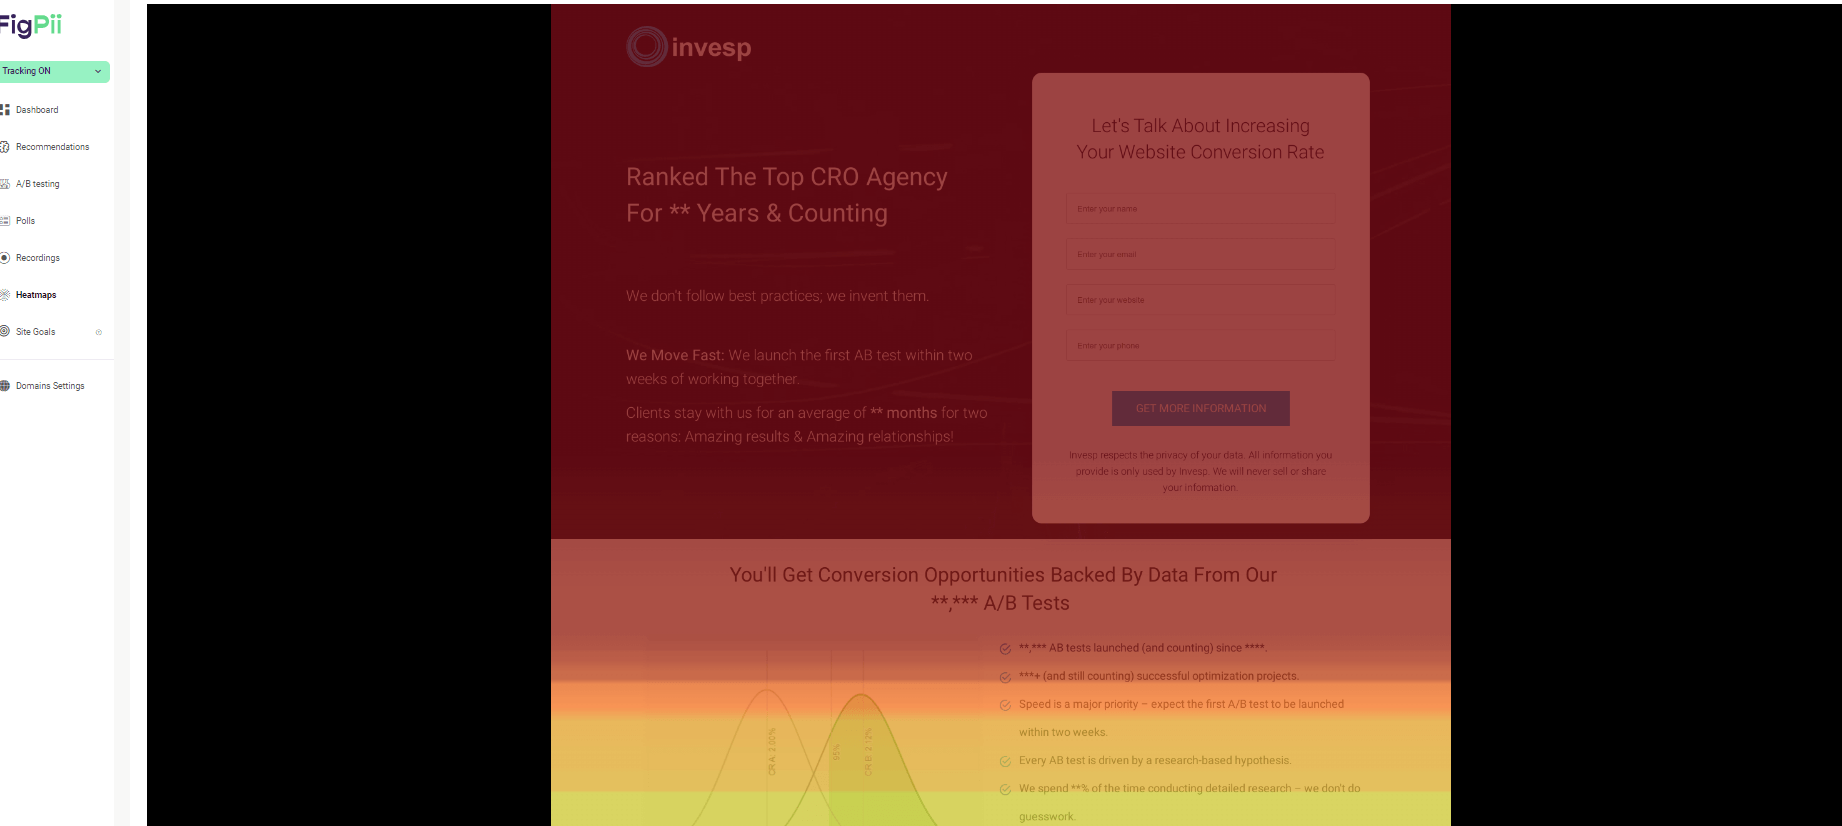
What Does Your Heatmap Look Like After Collecting Data?
Once your heatmap has gathered enough data, viewing the results is time. Here’s what you’ll typically see:
- Click Heatmap:
Areas of the page that received the most clicks will be highlighted in warmer colors, like red and yellow.
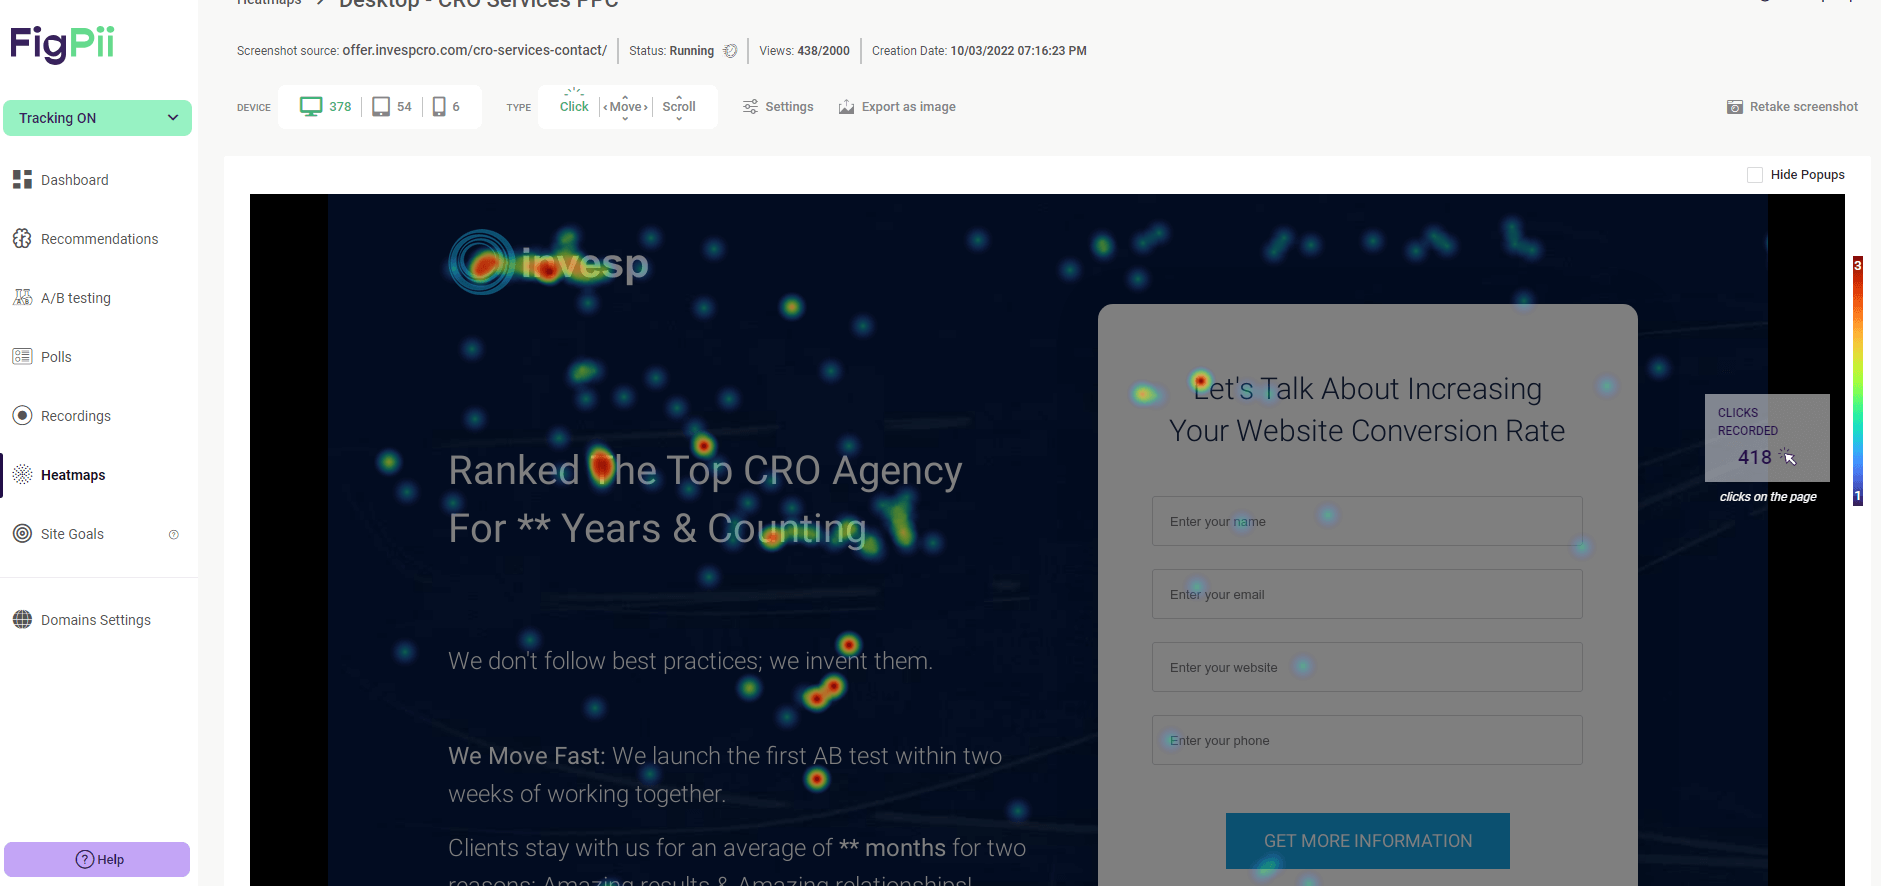
This helps you quickly see where visitors focus their attention, such as buttons, links, or images. Cooler colors (blue, green) show areas with fewer or no clicks.
- Scroll Heatmap:
This heatmap shows how far visitors scroll down the page. The top of the page will often appear in warmer colors, indicating that most visitors viewed that section, while cooler colors at the bottom may show areas where users stopped scrolling.
- Movement Heatmap:
This heatmap tracks mouse movements and often indicates where visitors’ eyes focus.
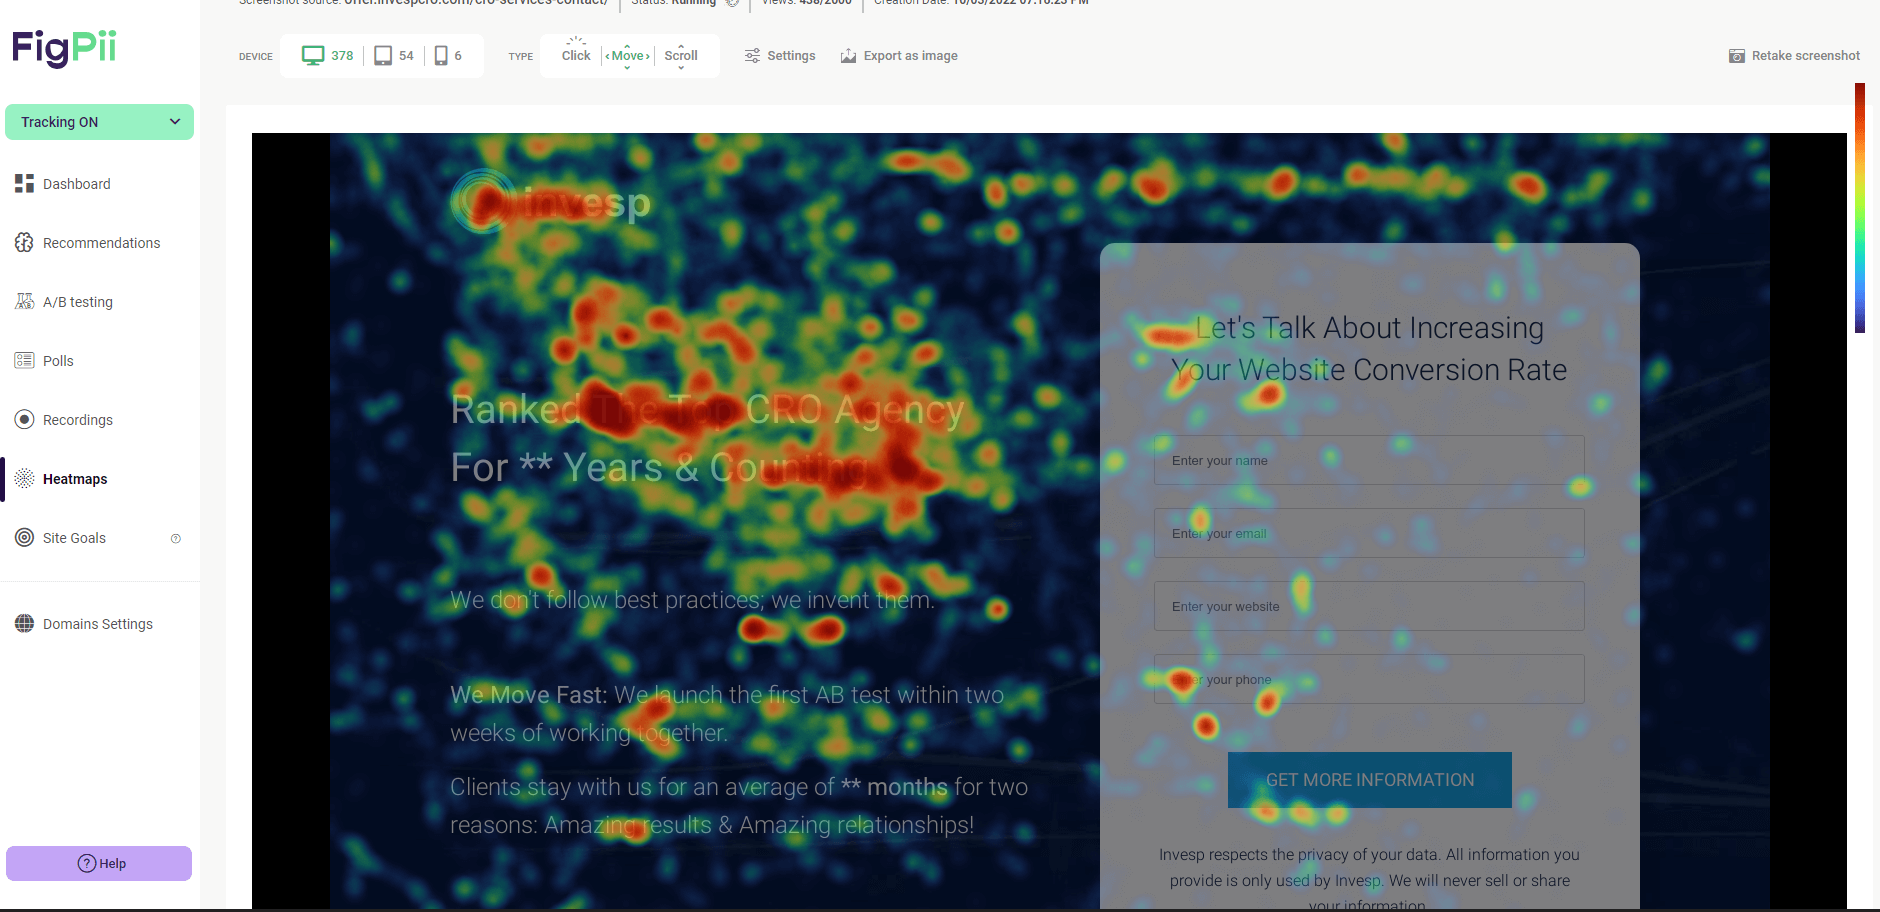
Like the click heatmap, warmer colors show the most engagement.
Conclusion
Using
free heatmap software
heatmaps gives you a clear view of how visitors interact with your website. When you are able to track clicks, scrolls, and mouse movements, you can identify which parts of the page are performing well and which areas might need attention.
With the step-by-step process outlined here, you can easily set up free heatmaps and gather insights. Whether you’re looking to improve a specific page or refine your overall website layout, the data from heatmaps will help you make informed decisions.
FigPii provides a straightforward way to collect this data, with options to track different devices, visitors, and page elements. Once your heatmap is set up, you can monitor user behavior and adjust your website based on real interactions.