

Did you know that in 2026, global ecommerce sales are projected to reach $8.1 trillion? With such a massive market, it’s more important than ever for e-commerce brands to track and analyze their website data to stay ahead of the competition.
Enter Google Analytics – a powerful tool that provides valuable insights into website performance. But with so many important Google Analytics metrics to choose from, which ones should your ecommerce website focus on?
In this article, we’ll explore the Google Analytics metrics every e-commerce brand should track to drive sales, improve customer experience, and stay ahead of the competition.
From traffic and sales metrics to customer and acquisition metrics, we’ve got you covered. Let’s dive into these essential Google Analytics metrics for your ecommerce business.
1. Traffic Metrics
A. Sessions
If you’re using Google Analytics to keep track of your website’s performance, one important metric to keep an eye on is “sessions.” A session refers to a user’s actions on your site within a certain timeframe. This could include anything from clicking on links to filling out forms.
Note that a session will automatically end after 30 minutes of inactivity or at midnight.
Sessions can help you measure the following:
- How many times have different users visited your website
- How long they stayed on your site
- How many pages did the users view per session?
You can also segment sessions by various dimensions, including device type, location, traffic source, etc., to get deeper insights into audience behavior and preferences.
For example, you can compare sessions from organic search vs. paid search to see which channel brings more qualified traffic to your site. You can also compare sessions from different countries or regions to see where your potential customers are located and how you can tailor your marketing strategy accordingly.
To track sessions in Google Analytics, head to Reports > Life Cycle > Engagement > Overview.
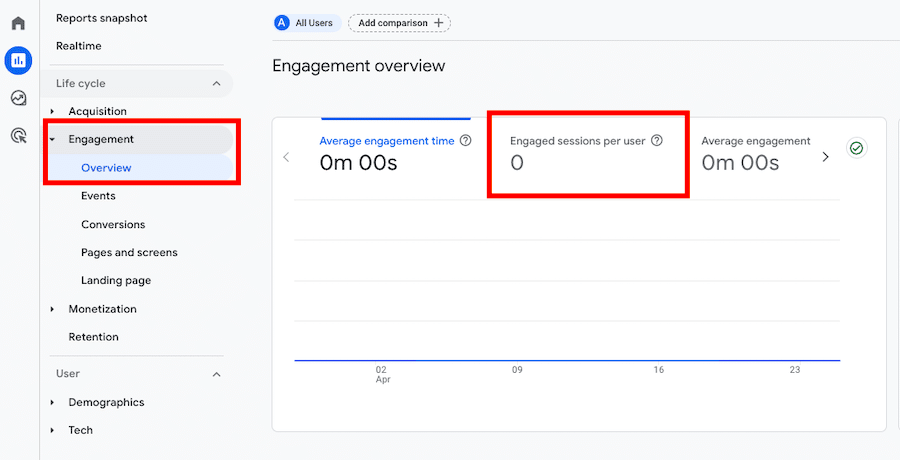
You’ll see a graph that shows the number of sessions and users over time. You can also scroll down for more details about session duration and engagement rate.
Note that the key to tracking sessions is learning to combine them with other metrics to understand user behavior better. For example, if you have high session counts but low time spent on-site, then it could mean that users are just browsing and not engaging with the content enough to convert.
B. Users
Right beside the “Sessions” graph, you’ll see a graph for “USERS IN LAST 30 MINUTES.”
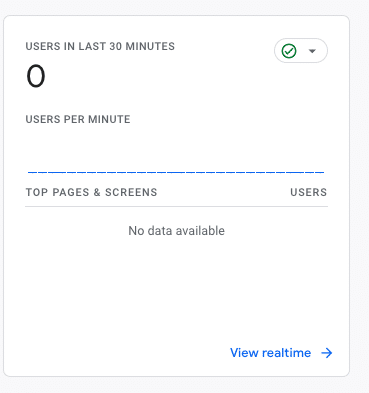
This metric tells how many unique visitors come to your site over time, giving you valuable insight into the health of your business.
For instance, if traffic declines over time or increases, it could indicate an issue with your marketing strategy or product offering. If people are visiting but not converting, you may need to improve your conversion funnel by testing different versions of landing pages or checkout flows.
C. Pageviews
A page view is when the user visits your website and views any part of one of your web pages. Unlike sessions, pageviews can count multiple views by the same user during the same session. Depending on your setup, a single visit can contain multiple page views.
For example, if a user visits your home page and then clicks through to another page, that will count as one visit but two pageviews.
Page views can help you measure your web pages’ popularity, performance, content quality, and relevance.
To track page views in Google Analytics, head to Reports » Life Cycle » Engagement » Pages and screens. Here, you’ll see a table that shows the number of page views and screen views for each page or screen on your website or app.
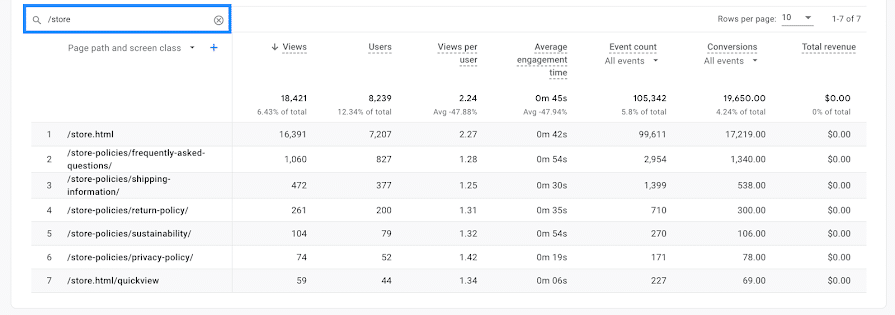
(Source)
You can also click on a page or screen name for more details about its performance.
D. Bounce Rate
Bounce rate is one of the most important metrics to track and one of the most misunderstood. Bounce rate refers to how many people leave your website without taking action other than viewing a single page.
For example, if a person lands on your homepage and clicks out without interacting with any other page, that would be considered a bounce. If someone lands on a product page and leaves without adding it to their cart or making any further purchase attempt within 30 minutes, it’s also a bounce.
With bounce rates, high numbers are not a good thing. If a visitor comes to your website and leaves without exploring any further, they likely could not find what they were looking for. Perhaps it’s time to give your website a makeover or take some SEO advice to make it more attractive and engaging for your audience.
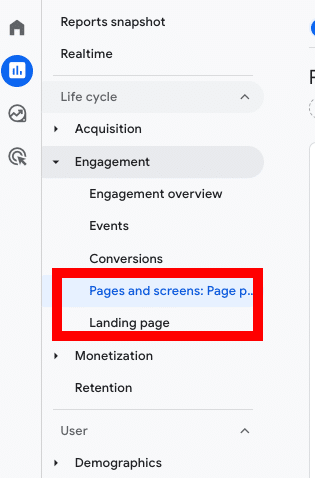
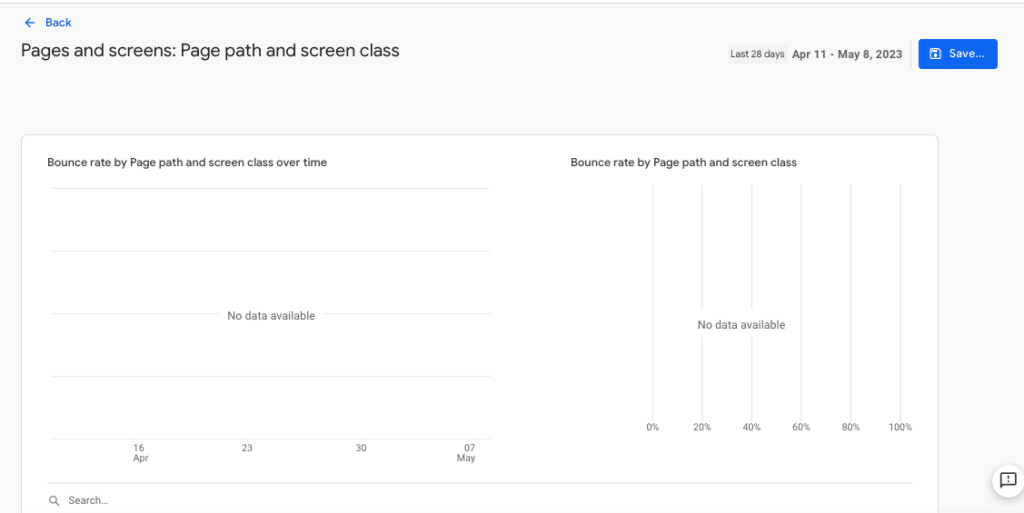
To discover this metric in GA4, head to Reports » Life Cycle » Engagement » Pages and screens or Landing page.
Once you’re there, you’ll have to customize the report to get access to the “Bounce Rate” metric.
From the top right, click Customize report and then click Metrics.
Add “Bounce rate” to the report and click Apply. You can also add other metrics or dimensions as needed.
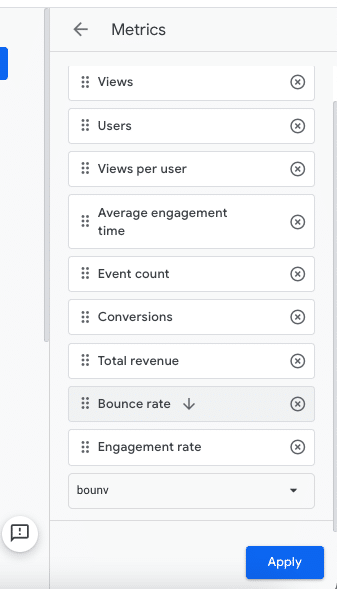
Save the changes to the current report or create a new one.
You can now see the bounce rate for each page or screen on your website or app. You can also use filters, segments, or date ranges to refine your analysis.
You can watch this video for more details on bounce rate and how to explore more about bounce rate with Google Analytics Universal and GA4:
Bounce Rate in Google Analytics 4
E. Average Session Duration
Average session duration is the average length of time that a user spends on your website within a given time period. It can help you measure the engagement and interest of your visitors, as well as the effectiveness and usability of your website.
This metric also gives you a good idea of how long users stay on your site before they decide to leave or move on to another page.
Suppose they spend too little time on any page or bounce after only one click (known as a “bounce rate”). That can indicate that something isn’t working well with that page. In this case, either the content isn’t interesting enough, or there isn’t enough compelling information on the page to keep visitors engaged for extended periods.
2. Sales Metrics
A. Conversion Rate
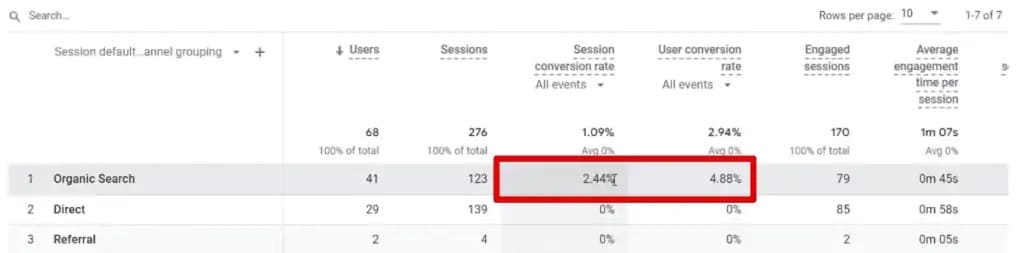
The Conversion Rate metric is one of the most important metrics for online businesses. It measures how many people who visit your site complete the desired action – whether it’s making a purchase or signing up for a newsletter.
For example, if 100 users visit your website, and five of them make a purchase, your conversion rate would be 5%. By tracking your conversion rate, you can identify which pages and products are most successful at converting visitors into customers.
Some factors that can affect your conversion rate include:
- Website design and usability
- Product quality and variety
- Pricing and discounts
- Shipping and delivery options
- Customer reviews and testimonials
- Trust signals and security
- Marketing and advertising campaigns
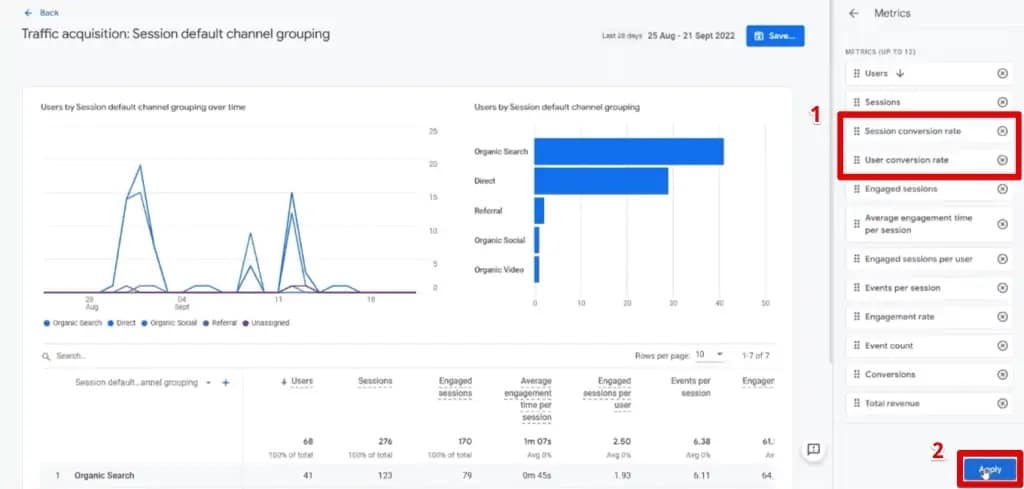
You’ll have to add new metrics, “Session conversion rate and the User conversion rate,” from the metrics section.
(Source)
Once you set up conversions in GA4, you can view and analyze them using various reports and features in GA4, such as:
- The Monetization reports show you the revenue, transactions, conversion rate, average order value, and other metrics related to your e-commerce performance.
- The Acquisition reports will provide insights into sources and mediums that drive users and conversions to your website or app.
- The Engagement reports will show how users interact with your content and products and how engaged they are with your website or app.
- The Retention reports display how well you retain users over time and how often they return to your website or app.
(Source)
B. Revenue
Revenue is a good indicator of how much money you make on your website, and it can help you understand what types of products are selling well and which ones are not.
Major factors that can influence your ecommerce revenue include:
- Visitors and conversions on your website
- The average order value and number of items per order
- The pricing and discounts of your products or services
- The shipping and delivery options and costs
- The customer retention and loyalty programs
- The marketing and advertising campaigns and channels
To view your revenue in Google Analytics, head to: Reports > Life Cycle > Monetization > Overview.
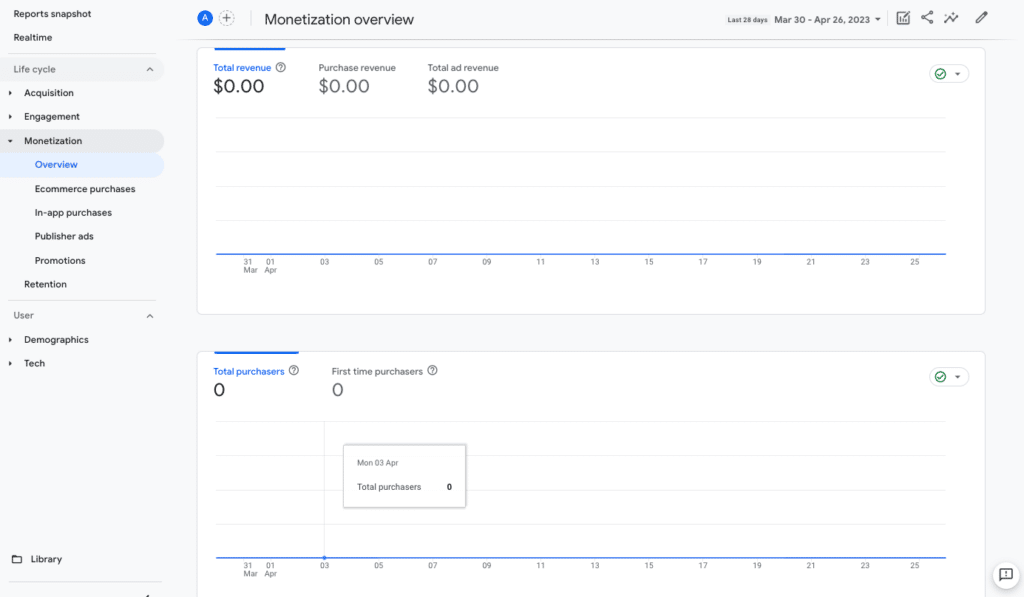
C. Average Order Value
When you scroll down the “Monetization overview” section in your Google Analytics account, you’ll see the graph showing the “Average purchase revenue per user.”
It’s the average amount of money customers spend on a single order. It’s an important metric because it shows how much your business makes per order.
D. Shopping Behavior Analysis
To analyze shopping behavior analysis, follow these steps:
- Log in to Google Analytics and head to Reports > Explore.
- Hit the + icon at the top right corner and select Funnel Exploration from the list of templates.
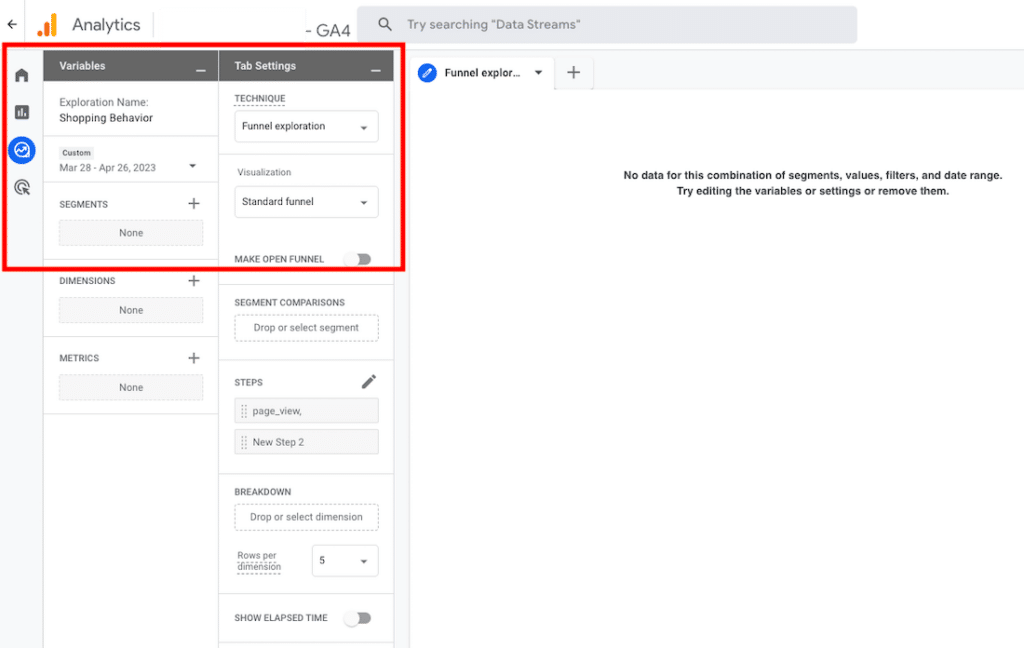
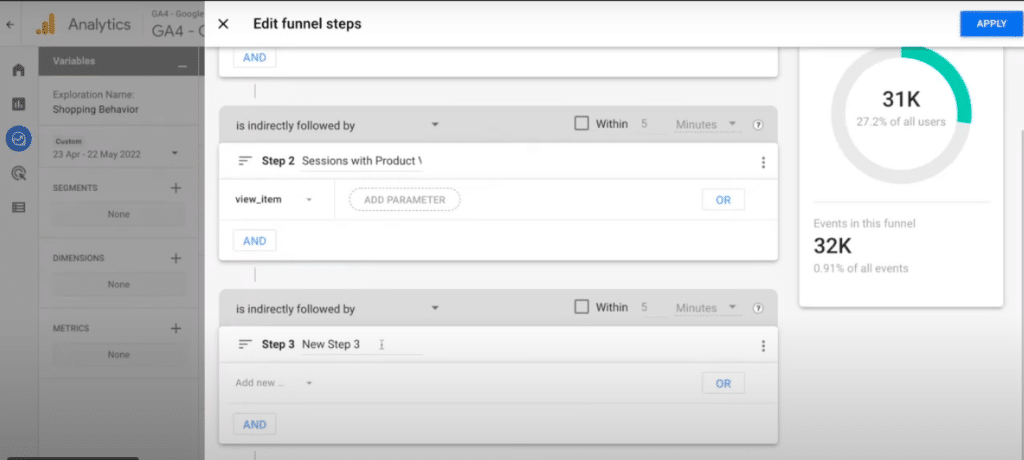
- In the Funnel steps section, add the events representing each stage of your shopping process. For example, you can add page_view, add_to_cart, begin_checkout, purchase, etc. You can also add custom events you created for your online store.
(Source)
- In the Filters section, you can apply filters to your exploration based on various dimensions, such as device category, traffic source, product category, etc.
- In the Settings section, you can adjust the settings of your exploration, such as date range, attribution model, segment comparison, etc.
- Click on Run Exploration to see your shopping behavior analysis report.
You will see a funnel chart that shows the number and percentage of users that completed each stage of your shopping process. You’ll also see a table that shows the details of each funnel step and the drop-off rate between each step.
3. Customer Metrics
A. New vs. Returning Customers
If you’re an ecommerce business, it’s essential to understand how many new customers you’re attracting and how many returning ones. While the former might seem like a more exciting metric, it doesn’t tell you everything about your business.
For example, if you have many returning customers but aren’t spending as much as new customers, you aren’t making enough money from those who have already purchased from you.
These ecommerce metrics are essential because they tell us how valuable each customer is to our business. If we know what percentage of our sales comes from new versus returning customers, we can better assess how well our marketing efforts are working to attract new customers.
To access the new vs. returning customers metric in the latest Google Analytics 4, you can:
- Use the Retention overview report under Life Cycle. You can toggle between New and Returning users and see metrics like retention rate, purchase revenue, and user engagement.
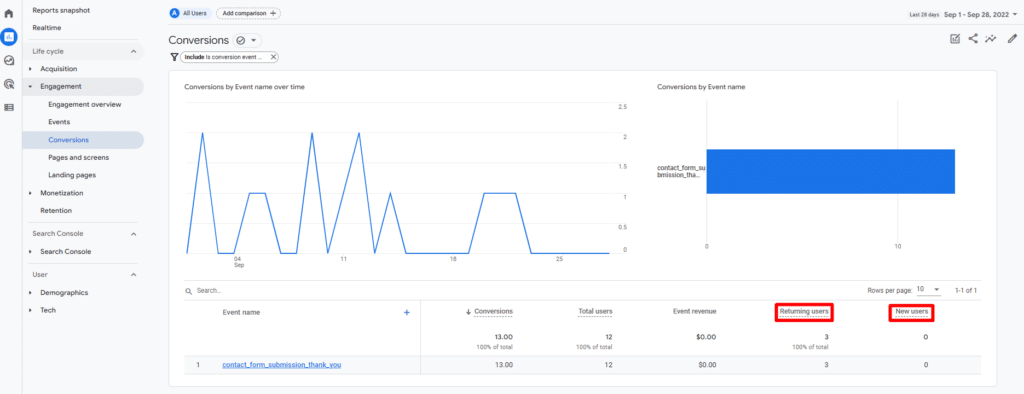
- Customize the Conversions report under Engagement. You can add New users and Returning users as metrics and see how many conversions are from each user type.
(Source)
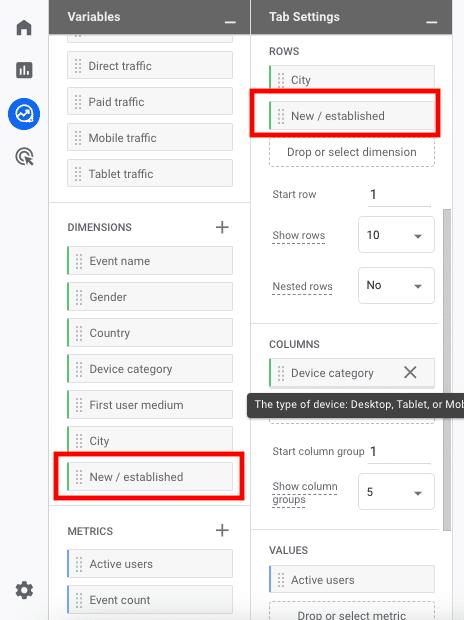
- Create a Free form report under Explore. You can select New / established as a dimension and see various metrics such as sessions, purchases, and revenue. New / established is similar to new vs. returning, except that new means the first visit is within the last seven days.
B. Customer Lifetime Value
Customer lifetime value is a customer-centric metric that shows how much revenue you can expect from each customer throughout their relationship with your business.
CLV helps you understand how valuable your customers are and how much you can afford to spend to acquire and retain them. A high CLV indicates customers who are more loyal, profitable, and likely to refer others to your brand. They also help you reduce your customer acquisition cost (CAC), which is the money you spend to attract a new customer.
Here are some ways to increase your customer lifetime value:
- Segmenting your customers based on their behavior, preferences, and needs and offering them personalized products, offers, and recommendations.
- Upselling and cross-selling your products
- Creating a loyalty program that rewards customers for their purchases, referrals, or social media engagement
- Providing excellent customer service and support via live chat, phone, or email
- Asking for feedback from your customers and using it to improve your products, services, and processes
- Creating engaging content that educates, entertains, or inspires your customers and showcases your brand personality
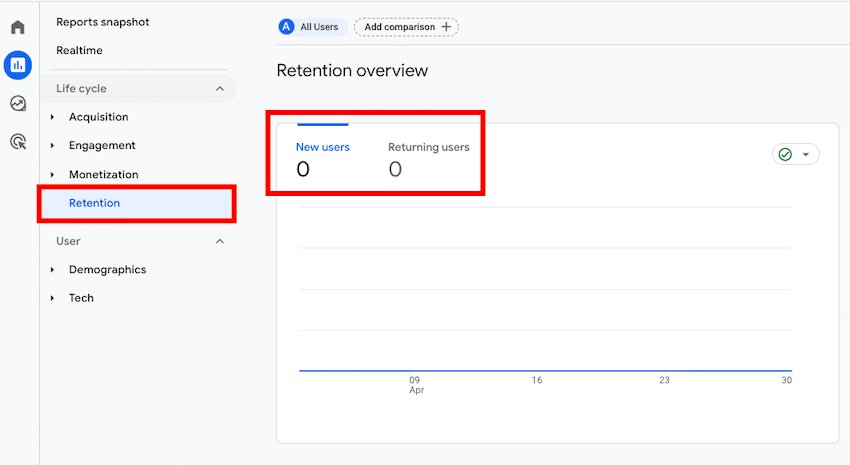
C. Customer Retention
The Customer Retention report in Google Analytics shows the percentage of returning visits (also known as “customer retention rate”) and the number of returning visits over time. A high percentage of returning visits indicates that your store is meeting the needs and expectations of customers.
You can find this metric in Google Analytics by simply going to Reports » Life Cycle » Retention.
Here are the top reasons you should track customer retention in Google Analytics:
- It tells you whether your customers are happy with their purchases
- It helps you understand how well your marketing campaigns are working
- Customer retention can help you identify issues with your e-commerce website and improve it
- It tells you how well your business is doing
D. Demographics
Demographics are customer data about gender, age, and income. This type of data is important because it helps you understand your customers better and improve your marketing efforts.
For example, suppose you find that your customers are primarily women between the ages of 35 and 50 with an average household income of $80,000. In that case, you know that you need to focus on these demographics to reach them better.
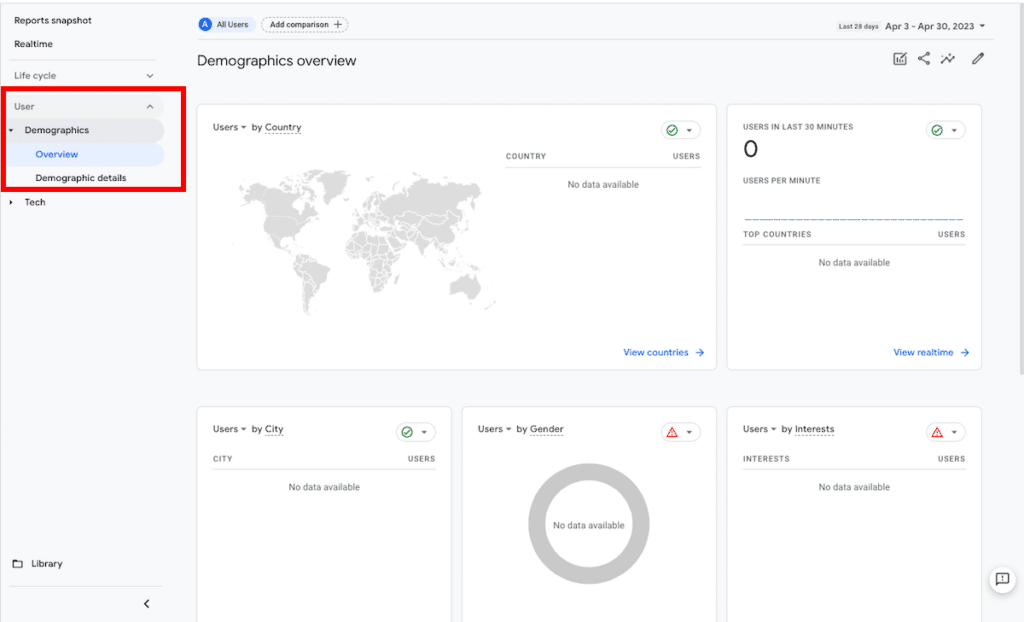
You can find this metric in Google Analytics through Reports » User » Demographics.
4. Acquisition Metrics
A. Channels
Channels are one way to break down how people found your website. For example, if someone found your website by searching for “women’s swimsuits” on Google, this would be considered Organic Search traffic.
You can find this metric in Google Analytics by going to Reports » Acquisition » Traffic Acquisition.
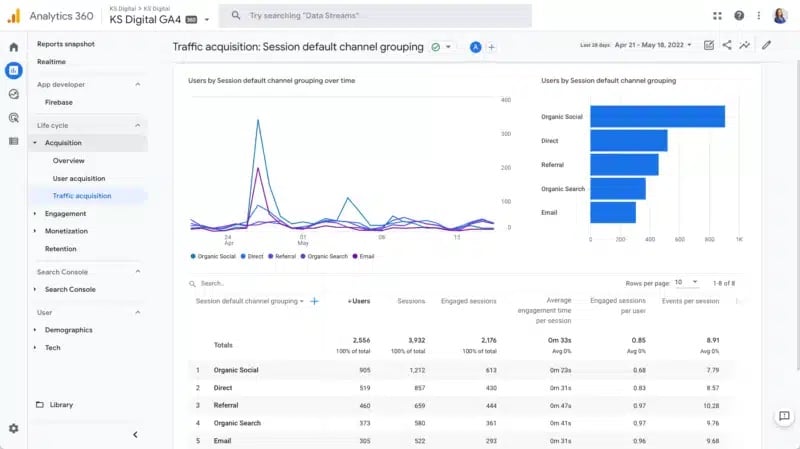
(Source)
B. Campaigns
Another acquisition metric that every ecommerce brand should track is the Campaigns that drive traffic and conversions to their website. They tell you how your specific marketing campaigns are performing, including email campaigns, social media campaigns, or paid advertising campaigns.
To discover how well your campaigns are performing in GA4, you can head to:
- The Traffic Acquisition report under Acquisition. You’ll see the number of sessions, users, and revenue by campaign name, source, medium, and other dimensions.
- The User Acquisition report under Acquisition. Again, you’ll be able to discover the number of new users, revenue per user, and engagement rate by campaign name, source, medium, etcetera.
- The Analysis module under Explore. You can create custom reports and visualizations using campaign name, source, medium, and other dimensions and metrics.
That’s a Wrap!
Tracking the right Google Analytics metrics is essential for the success of any ecommerce brand.
Google Analytics provides valuable insights into the performance of your online store and helps you make data-driven decisions to improve your sales and customer engagement.
Furthermore, the latest version of Google Analytics, GA4, offers even deeper insights and predictive analysis to help you track and analyze your website performance.
You can understand your audience and optimize your website by tracking metrics like sessions, bounce rate, conversion rate, revenue, average order value, shopping behavior analysis, new vs. returning customers, customer lifetime value, and more.
With Google Analytics, you can access all these ecommerce metrics, key performance indicators, and more and use them to drive growth and profitability for your ecommerce store.