

Tracking conversion metrics is like being a pilot flying a plane. When you’re in the air, you must keep a close eye on your basic instruments, like the airspeed indicator, altitude indicator, altimeter, etc., to ensure you’re on course and heading in the right direction.
Similarly, when it comes to conversion rate optimization, you need to track the right metrics to ensure you’re progressing toward your business goals. But just as a pilot doesn’t need to monitor every instrument on the dashboard, you don’t need to track every website metric to achieve success.
Focusing on the wrong metrics or too many can be counterproductive, So which conversion optimization metrics should you track?
In this article, we’ll look at the key metrics to focus on and how to use them to steer your business toward success.
What is Conversion?
Before we get into what conversion rate optimization is, let’s talk about what conversion is:
Imagine you’re a street vendor selling ice cream. Your ultimate goal is to sell passersby as many ice creams as possible. Your main task will be identifying the people most likely to buy and then persuading them to purchase.
In marketing, this process of converting potential customers into paying customers is known as conversion. It involves getting website visitors to take a specific action, such as buying a product, paying for a service, or subscribing to a newsletter.
Businesses and marketers need to identify their target audience, understand their needs and preferences, and then use various tactics to persuade them to take a desired action.
Conversion Optimization
Now, let’s get into what Conversion Optimization is
Conversion optimization in marketing typically involves analyzing websites to identify areas where visitors may be dropping off or experiencing friction in the conversion process.
Additionally, conversion optimization involves identifying and testing various strategies to increase the number of people who take a desired action.
The goal of conversion rate optimization is to improve the effectiveness of your website and other marketing efforts to convert.
A Case Against Conversion Rate As A Metric
Before we go too far into conversion rate optimization metrics and why they are important, let’s discuss the downside of hyper-focusing on conversion rate as a metric when trying to optimize a website.
According to Khalid Saleh, the CEO of Invesp:
Conversion Rate is a meaningless metric.
Don’t get him wrong; conversion rate is an important metric. However, you must also consider other important factors before drawing a reasonable conclusion from your conversion rate.
These factors include:
-
Visitors Rate to Conversion Rate
To put it into perspective, imagine a website with 100 visitors gets 7 orders monthly, and its conversion rate is 7%. Now, if there’s another website with 10000 monthly visitors with 700 orders in a month, the conversion rate is also 7%.
While both conversion rates are the same, you will agree that the second website isn’t doing as great as the first regarding revenue and conversion.
When checking conversion rate, it’s necessary to consider the number of website visitors (traffic).
-
Conversion Rate based on Device
A mistake that many businesses make when measuring conversion rates is failing to distinguish between conversions based on the device used by site visitors. Even though it’s the same website, not separating conversions for mobile and desktop devices gives an inaccurate analysis.
For instance, you won’t know whether you have more mobile or desktop visitors, making it difficult to determine which site version needs improvement.
-
Micro Conversions
Before visitors eventually convert to your website, they must have gone through several steps. These steps begin when they get on your landing page, visit your product pages, add products to the cart, and eventually check out. All these steps are known as micro conversions, and it is also essential to track them alongside your conversion rate.
The important lesson is that focusing only on your site’s conversion rate can be misleading. Therefore, consider other metrics that can provide additional insight and explain your conversion rates.
Conversion Optimization Metrics and why they’re Important
Conversion optimization metrics are the measures used to evaluate the effectiveness of marketing efforts businesses put into converting potential customers into paying customers or achieving other business objectives.
These metrics could include click-through rates, conversion rates, bounce rates, and revenue per customer.
Conversion rate optimization metrics are important to businesses because they help:
- Identify trends: Tracking conversion rate optimization metrics helps you identify trends in your data. This can help you to see whether your conversion rate is improving or declining and understand the reasons behind these changes.
- Improve user experience: User experience is a vital part of conversion optimization. When you track conversion optimization metrics, you can better understand how users interact with your website or products and find ways to improve their experiences where needed.
- Save Time and Resources: Imagine trying to gain or lose weight and not having a body weight scale to track your progress. Not ideal, right? Tracking conversion optimization metrics helps you determine what works and what doesn’t, which helps you save time and resources, which you can allocate to more effective methods.
Not having metrics for conversion rate optimization is like going to a supermarket without a grocery list. While you might remember some of the things you need, there’s a high possibility of buying the things you don’t need.
Primary Metrics for Conversion Optimization
Think of a primary conversion optimization metric as the score in a basketball game where the game’s primary goal is to win. The score directly measures a team’s success in achieving its goal, and it is the primary metric the coaches, players, and fans will focus on during the game.
A primary conversion optimization metric is a metric that directly measures the success of a website or product in achieving its primary goal.
For example, if the primary goal of a website is to generate sales, then the primary conversion optimization metric would be the number of completed sales.
Examples of Primary Metrics To Track
-
Order Confirmation
As a conversion metric, it provides valuable information on the effectiveness of your website’s sales funnel and its ability to generate revenue. A high order confirmation rate means your website effectively guides customers throughout their purchasing journey.
In contrast, a low rate indicates that there may be issues with the website’s user experience or checkout process.
Metrics like order confirmation can only be tracked on specific website pages since it’s usually the last step in the customer journey. Focusing on order confirmation tells you the number of customers that complete a purchase, and not necessarily where the customers that don’t complete a purchase drop off.
Therefore, other things to note alongside this metric are the pages leading up to the order confirmation, such as the product description pages, billing, and shipping information pages, payment confirmation pages, etc.
If you have a low order confirmation rate, monitoring the pages leading up to order confirmation can show where customers drop off. This information can, in turn, be used to improve your website.
-
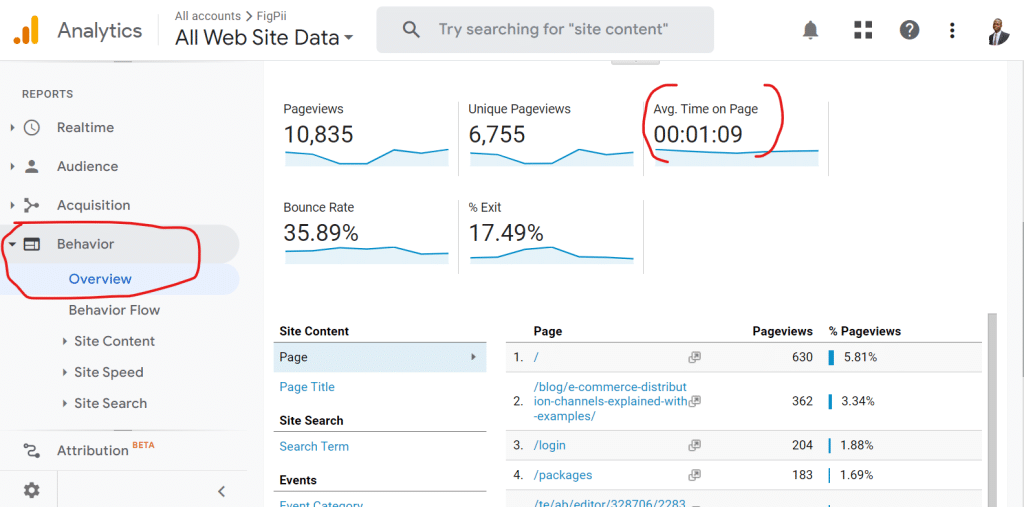
Average Time on Page
Think of the average time on page like a movie. The better movie, the longer viewers watch and anticipate the next scene. Average time on page measures how long visitors spend on a page(s) on your website.
If you run an Ecommerce website, you should expect your product description pages to have a reasonable (at least 52 seconds) average time on page. However, a low average time on your product description pages and a low conversion rate could mean a problem with those pages regarding design or content.
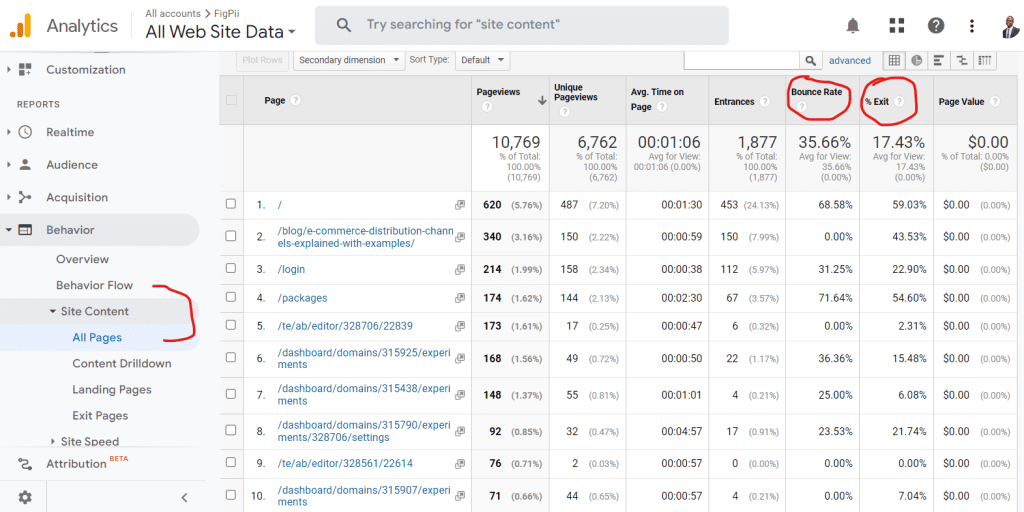
- Log in to your Google Analytics account.
- Go to the “Behavior” section on the left-hand side of the dashboard.
- Click on “Site Content” and then “All Pages.”
- You should now see a list of all the pages on your website, along with metrics such as page views, bounce rate, and average time on page.
-
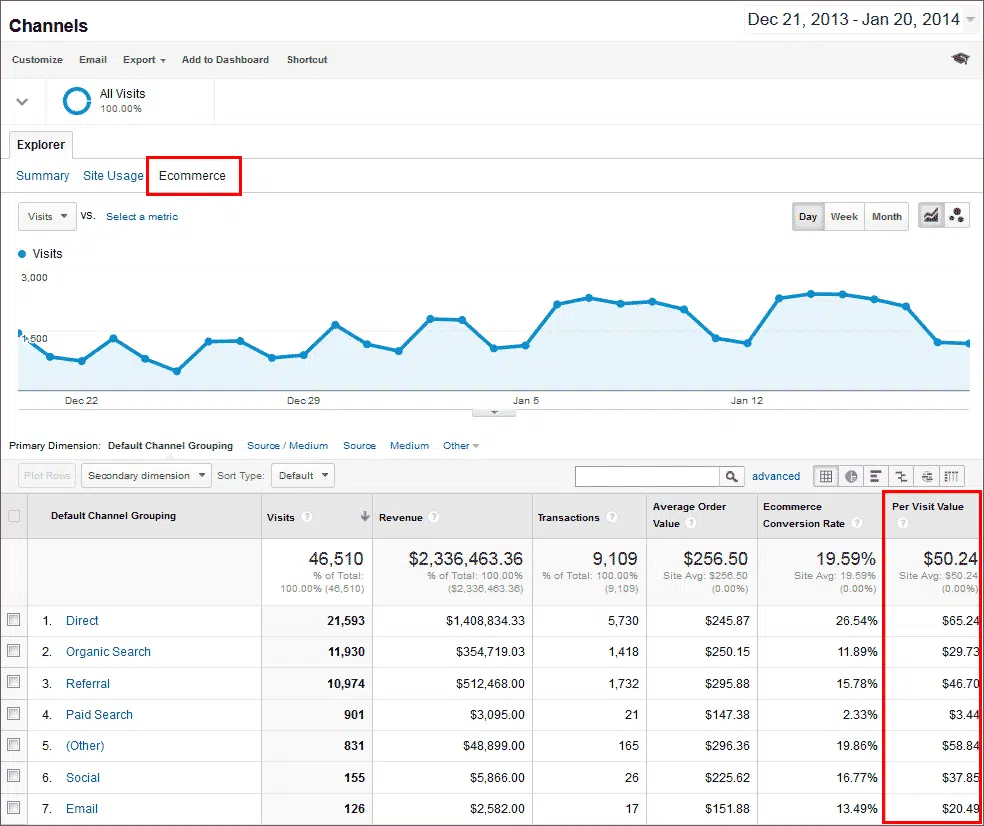
Revenue Per Visitor
One of the effective ways to measure your marketing and sales effort is by tracking your revenue per visitor. RPV is a measure of how much money you’re making for every visitor that visits your website.
For example, an ecommerce website with total revenue of $5000 in a month with 200 visitors will have a revenue per visitor of $5000/200 = $25
This means that each website visitor generated $25 in revenue on average.
If you spend money on acquiring new customers, tracking your revenue per visitor can be a way to evaluate the effectiveness of your customer acquisition strategies. A low RPV could indicate a problem in your sales or conversion funnel or that the visitors coming to your website are not completing their orders.
To accurately measure your RPV, you should use unique visitors rather than the overall site traffic for the period you plan to track RPV. This is because RPV considers visitors, not visits, and there is a high chance that first-time visitors may not make any purchases.
- Log in to your Google Analytics account.
- Go to the “Conversions” section on the left-hand side of the dashboard.
- Click on “E-commerce” and then “Overview.”
- You should now see a graph showing your e-commerce revenue over time.
- To see the revenue per visitor, look for the “Per Visit Value” metric in the middle of the page.
- This metric shows you the average revenue generated per session (i.e., visit) on your website.
-
Cost Per Acquisition
This metric helps businesses answer the question, “was it worth it?”. This metric measures the cost of acquiring a customer or lead, typically through advertising or other marketing efforts. Tracking this metric is necessary because it directly impacts a business’s profitability and identifies where it can cut costs.
To get additional insights from your CPA, other metrics like ROI, which measures the return on investment on different marketing campaigns and channels, ROAS (Return On Advertising Spend), which measures the effectiveness of your advertising in generating desired results, and conversion rate.
These additional metrics, alongside your cost per acquisition, give you a complete picture of your performance in terms of advertisements and campaigns. It also reveals the strategies that are most effective in acquiring new customers.
Cost Per Acquisition is calculated by dividing the campaign cost by the number of customers acquired. CPA = Campaign Cost/ Customer Acquired
-
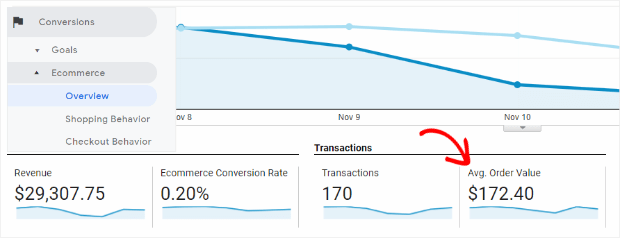
Average Order Value
It measures the average value of each order placed on your website. To calculate your average order value, divide your total revenue from sales by the total number of customers.
Average Order Value = Sales Revenue/ Number of Orders
It’s necessary to track your average order value because it helps you evaluate the efficacy of your marketing efforts, identify trends in customer purchasing behavior, and identify opportunities to implement different pricing strategies.
Sometimes, you don’t need to spend much money acquiring more customers before making a profit. If you can increase the average order value of your existing customers, there’s a high possibility of increasing sales by a significant percentage.
Different strategies to increase your average order value include cross-selling similar products, upselling products, and offering incentives like free shipping, volume discounts, and coupons.
To better understand your business and customer behavior, you should track conversion rate, customer lifetime value, and cart abandonment rate metrics.
To track your site’s average order value in Google Analytics, do the following:
- Visit the official Google Analytics website and log into your Analytics account.
- Once logged in, navigate to the “Conversions” tab on the left side of the page.
- Next, select “eCommerce” and click “Overview” from the dropdown menu.
- After selecting “Overview,” you will be presented with various metrics, including “Avg. Order Value,” which displays the AOV for your entire site.
-
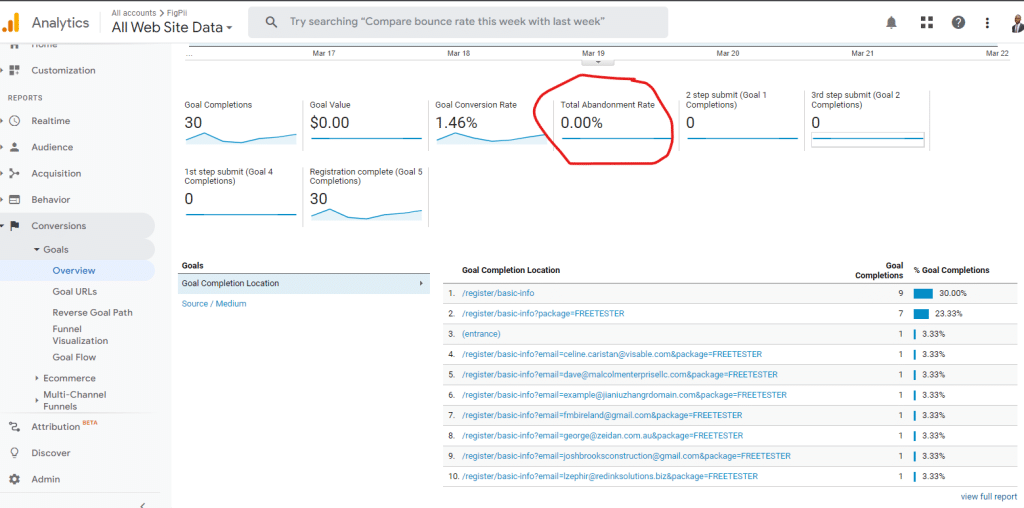
Cart Abandonment Rate
The cart abandonment rate measures the percentage of online shoppers who add items to their cart but do not complete the purchase. It typically represents the number of lost potential sales and revenue.
Tracking your website’s cart abandonment rate helps identify why customers are not completing others. It could reveal problems, if there are any, in your sales funnel, checkout process, or the user experience of your website.
The shopping cart abandonment rate is not enough in making decisions, especially if your website handles a small volume of sales; the data can be unreliable. In a situation like this, consider tracking metrics such as website speed, average order value, and gross profit margin to understand better why users are abandoning their carts.
To track your cart abandonment rate in Google Analytics, do the following:
- Go to your Google Analytics account.
- Once logged in, navigate to the “Conversions” tab on the left side of the page.
- Select “eCommerce” and click “Shopping Behavior” from the dropdown menu.
- In the “Shopping Behavior” report, you can see the number of cart abandonments at each stage, allowing you to calculate your cart abandonment rate.
-
Return On Investment (ROI)
This metric is like a stock portfolio. Just as investors track the return on their investments in different stocks, businesses track the ROI in different marketing campaigns to ensure they make the most effective use of their resources.
ROI is an important metric to track because it helps you measure your site’s overall success and evaluate its worth. Additionally, tracking your site’s ROI can help you optimize your spending since you’ll be able to identify the efforts that yield the best results.
ROI is not only limited to marketing efforts. It also extends to the products and services that you offer. With ROI as a metric, you can identify the products and services that generate the most revenue and focus on promoting those and maximizing profits.
There are many other primary metrics, but these are some of the most important ones.
Secondary Metrics for Conversion Optimization
Remember the basketball game example we used earlier? Let’s revisit it. We defined primary conversion optimization metrics as the score in a game.
Secondary conversion optimization metrics can be compared to more specific statistics, like free throw percentage, three-point shooting percentage, or steals per game. These metrics provide more detailed insights into individual player performance and can help coaches and players identify areas where they can improve their game.
While secondary metrics are helpful, they are not the primary indicator coaches, and players focus on to win the game. Similarly, businesses should prioritize tracking primary conversion optimization metrics to ensure they are on track to achieve their goals while also utilizing secondary metrics to gain more detailed insights into their conversion optimization.
As a basketball fan, if you miss watching a game, you first want to know the score or which team won. Afterward, you can ask specific questions about which player got the most points, assists, or blocks.
Examples of Secondary Metrics To Track
-
Exit Rate
This is the percentage of visitors who leave your website from a specific page. Exit rate is a useful metric to track because it helps you identify your site pages where visitors drop off. This information can, in turn, be used to identify the issues that are causing your exit rate to increase,
Tracking exit rates will help you identify issues such as poor design, slow loading times, or unclear navigation, which are the causes of high exit rates on websites.
Optimizing your website by improving page speed, providing quality content, and enhancing website design and layout can help reduce the exit rate on web pages.
-
Bounce Rate
Have you ever been on a website and realized within a few seconds that the website has nothing of value to you? What did you do afterward?
Bounce rate is the percentage of people who land on your website and leave without moving past the initial page or taking action, such as clicking a button, entering their information, or navigating to another page within the same website.
Slow loading times, poor user experience, the irrelevance of site content, pop-ups, bokeh image links, crashes, and lack of mobile responsiveness are common reasons your site might be experiencing a high bounce rate.
Bounce rate metrics can provide valuable insights to help you identify website usability issues, conversion-related barriers, improve content relevance, and identify pages that need improvement.
Bounce rate and exit rate are often affected by the same problems. Therefore, with the same approach, you can improve both metrics. Some of these strategies include:
- Improve page load speed: Slow page load speeds can cause visitors to leave your site quickly. Ensure your website is optimized for speed by compressing images, caching, and minimizing code.
- Enhance website design and user experience: A clean, intuitive website design can improve user engagement and reduce bounce rates.
- Ensure content quality and relevance: Visitors are likelier to stay on your website if your content is informative, useful, and relevant to their needs.
- Use internal linking: Internal linking can help guide visitors to other pages on your website, keeping them engaged and reducing bounce rate.
- Implement exit-intent popups: Exit-intent popups are triggered when visitors are about to leave your website. They can offer a last-minute incentive or encourage visitors to subscribe to your newsletter, reducing the exit rate.
How to check Exit Rate and Bounce Rate in Google Analytics
To check the exit rate and bounce rate in Google Analytics, you can follow these steps:
- Login to your Google Analytics account and select the website you want to check.
- Navigate to the “Behavior” section on the left-hand side of the screen and click on “Site Content” and then “All Pages.”
- Once you’re on the “All Pages” screen, you can see a list of all the pages on your website and their respective metrics.
- You can view the exit rate of each page by clicking on the “Exit %” column header. The exit rate represents the percentage of visitors who leave your website from a specific page.
- To view the bounce rate, click on the “Bounce Rate” column header.
-
Social Media Engagement (Likes/Comments)
The number of likes and comments on social media posts related to your business. Users reposting and sharing your social media posts also counts as engagement.
When you see a post or meme online that you can relate to, no one needs to tell you before you engage with it and also share it with your friends online. This shows that you find the content relatable or relevant.
While social media engagement rate may not directly affect your conversion rate, it provides valuable insights into how well your brand connects with your audience on social media platforms. If your audience finds your social media content engaging, it increases your chances of getting leads, which can turn into paying customers.
Increasing social media engagement requires strategic planning, creative content, and consistent engagement with the audience. Here are some tips to increase your social media engagement:
- Post engaging content: To increase social media engagement, it’s necessary to create content that is interesting, valuable, and relevant to your audience. This can include visual content, such as photos and videos, and written content, such as blog posts and infographics.
- Use social media hashtags: Hashtags can help increase the visibility of your social media posts and make them easier to find for users interested in a particular topic. Research relevant hashtags and include them in your posts to increase reach and engagement.
- Encourage user-generated content: Encourage your audience to create and share their own content related to your brand or products. This can include running contests, featuring user-generated content on your social media channels, and responding to user comments and feedback.
- Engage with your audience: Respond to comments, messages, and mentions promptly and authentically. This shows that you value your audience’s input and can help build trust and loyalty.
- Use calls-to-action (CTAs): Encourage your audience to engage with your content by including clear and compelling CTAs in your posts. This can include asking questions, inviting feedback, or prompting users to share or like your posts.
- Post consistently: Regularly posting fresh and relevant content can help keep your audience engaged and interested in your brand. Consistency is key, so establish a posting schedule and stick to it.
Most social media platforms like Twitter, Facebook, and Instagram have analytics tools that help you track your posts’ performance and identify improvement areas.
-
Page Load Time
Apart from being a secondary conversion metric, page load time is also a contributing factor to both exit and bounce rates.
Page Load Time is the amount of time it takes for a page on your website to load. A slow page load time can lead to a poor user experience and increase the likelihood of visitors leaving your site.
Your site’s page load time is also important because it directly affects your website performance, speed, conversion rate, SEO ranking, and overall user experience. Some factors affecting page load time are poor server performance, poor site design, incorrectly configured browser caching, user internet connection, image sizes, and code efficiency.
Let’s discuss some of the best strategies to employ if you want to optimize your site’s page load time:
- Image Optimization: Optimize images by compressing them to reduce their file size, using the appropriate format (JPEG for photographs, PNG for graphics), and reducing the image dimensions to the required size.
- Video Optimization: Optimize Video by compressing them to reduce their file size, using a video compressor in the appropriate format (MP4 most acceptable format), and reducing the Video dimensions to the required size.
- Minify Code: Minify HTML, CSS, and JavaScript code by removing unnecessary spaces, comments, and line breaks. This reduces file size and speeds up page load times.
- Use Content Delivery Networks (CDNs): CDNs can cache content on servers closer to the user, reducing the time it takes to load a page.
- Leverage Browser Caching: Configure the server to add expiration dates to static resources such as images, CSS, and JavaScript so that the user’s browser can cache them for a longer period, reducing the need to download them repeatedly.
- Reduce HTTP Requests: Minimize the number of HTTP requests by combining CSS and JavaScript files and reducing the number of images and other resources loaded on the page.
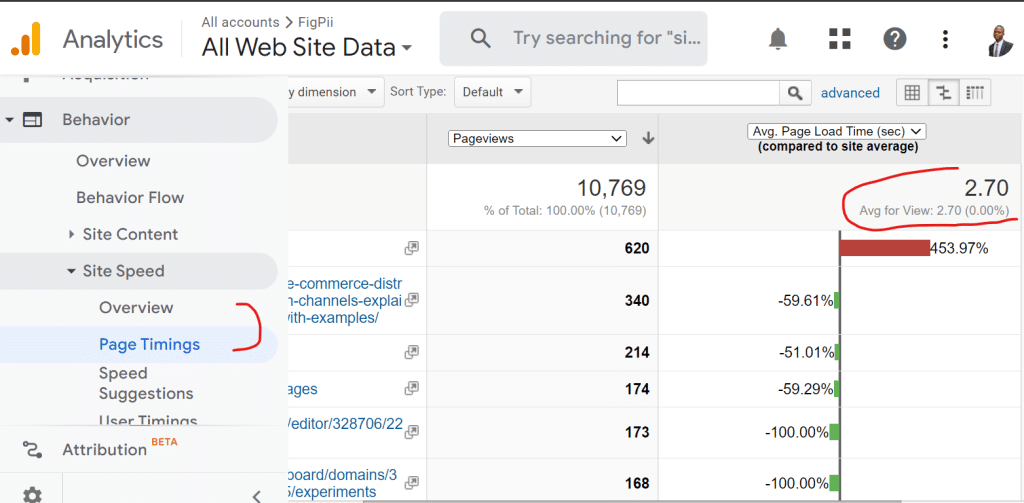
To track your page load time in Google Analytics, do the following:
- Login to your Google Analytics account and select the website you want to check.
- Navigate to the “Behavior” section on the left-hand side of the screen and click on “Site Speed” and then “Overview.”
- On the “Overview” screen, you will see a graph showing your website’s average page load time.
- You can click on the “Page Timings” tab to view the average load time for each page on your website.
-
Pages Per Visit
Also known as pages per session, it is the average number of pages a visitor views during a single visit to your website. Tracking pages per visit is important because it provides insights into your website visitors’ engagement.
Pages per visit also indicate how engaging users find your content and how your content is performing. It can also help you identify visitors engaging the most with your site content, and you can target these visitors with relevant marketing messages, which can ultimately increase conversions.
If you want to increase your pages per visit, here are some of the effective ways to go about it:
- Improve Website Navigation: Ensure your visitors can easily find what they want and easily move from one page to another.
- Related Content: Include links to related content on each page to encourage visitors to explore more of your website.
- Internal Linking: Use internal linking to guide users to other relevant pages on your website. Internal links help visitors find more content that interests them and help search engines crawl your site more effectively.
- Calls to Action: Include calls to action (CTAs) on your pages to encourage visitors to take a specific action, such as signing up for a newsletter or registering an account.
- Content Quality: Ensure your content is engaging, informative, and relevant to your target audience. High-quality content can keep visitors on your website longer and encourage them to explore more of your website.
- Site Speed: Improve your website’s load speed to encourage visitors to view more pages. Visitors are less likely to view additional pages if your website takes too long to load.
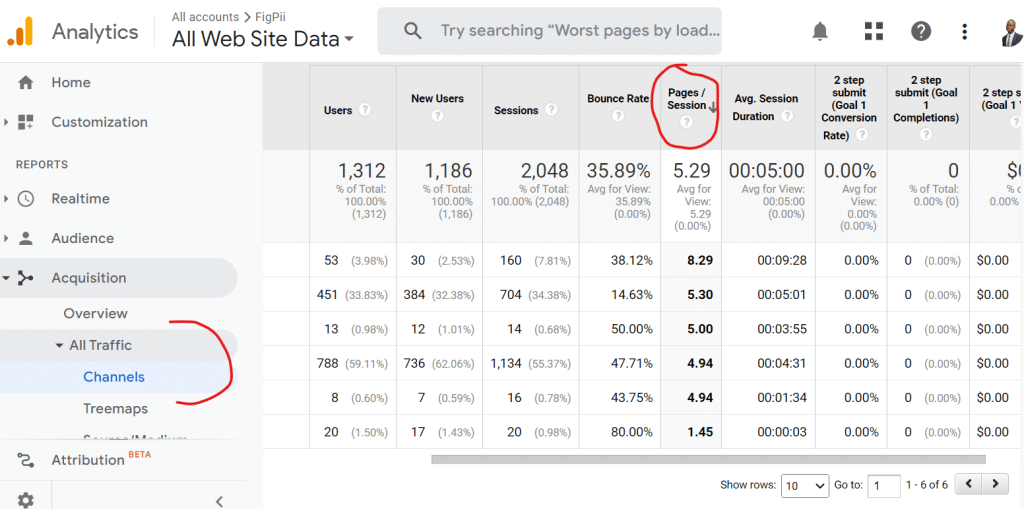
To track “Pages Per Visit” on Google Analytics
- Log in to your Google Analytics account
- Click on “Acquisition” in the left-hand menu.
- Click on “All Traffic.”
- Click on “Channels.”
- Look for “Pages/Session” in the table. This will show you the average number of pages viewed per visit broken down by channel (organic search, direct, referral, etc.).
-
Click-Through Rate (CTR)
CTR is the percentage of clicks a particular link or ad receives relative to the number of impressions or views it generates. It provides valuable insights into how your audience responds to your content, how engaging your marketing messages are, and how effectively you convert views into clicks.
Tracking CTR is important when measuring the effectiveness of your ads, email campaigns, marketing messages, and calls to action. Additionally, it also serves as a benchmark for measuring the success of your campaigns over time by comparing current CTRs to previous CTR to see whether there’s an improvement or decline.
Let’s discuss some of the strategies for improving your CTR:
- Write compelling headlines: The headline is the first thing people see, so it needs to grab their attention and encourage them to click. Use strong, action-oriented language, and make sure your headline is relevant to your target audience.
- Use eye-catching visuals: Use visuals such as images, videos, and graphics to make your content more engaging and increase the likelihood of someone clicking through to your website.
- Personalize your content: Personalizing your content for your target audience can increase engagement and CTR. Use data such as location, interests, and demographics to tailor your content.
- Optimize for mobile: With more and more people accessing the internet on mobile devices, ensuring your content is optimized for mobile viewing is important. Make sure your content is easy to read and navigate on small screens.
Using Conversion Optimization Metrics To Improve Site Conversion
To use conversion rate optimization metrics to improve site conversion, you can implement several key strategies, including.
-
Identify areas for improvement.
The reason why you have a conversion optimization goal and metrics in the first place is to help your business improve and increase sales and conversion. Review your primary and secondary metrics to identify areas that need improvement.
Prioritize these areas based on their impact on your overall conversion rate. This will help you focus your efforts on the most critical aspects of your site or product.
-
Personalize User Experience
Tracking metrics like pages per session, exit rate, average time on page, and social media engagement can help you better understand your audience and the type and content they relate to.
This can help you create a more personalized user and customer experience. To achieve this by showing personalized product recommendations, offering customized promotions, or providing targeted content based on user behavior on your site.
-
Run A/B Tests
We can’t talk about conversion rate optimization without mentioning split testing. Split testing, also known as A/B testing, is necessary when optimizing conversion rates. By testing different variations of your site, you can determine which changes impact your conversion rate. This could include changes to your site’s design, copy, or call-to-action buttons.
Use your primary and secondary metrics to track the impact of each variation and make data-driven decisions about which changes to implement.
When choosing a testing tool, there are some essential features of A/B testing tools to consider before deciding which tool to use.
-
Measure The Impact of Changes
After your A/B test, you will likely make changes to your website. However, these are important to note after running your split test.
- Identify the metrics that will be affected by the change: Before implementing any changes, identify the key metrics that those changes will impact. This will help you measure the effectiveness of the changes later on.
- Implement the changes: Once you have identified the metrics, implement the changes where necessary.
- Monitor the metrics: After implementing the changes, closely monitor the identified metrics over time to see if they have been positively or negatively impacted.
- Analyze the results: Analyze the results to determine whether the changes positively or negatively impacted the identified metrics. This will inform the next steps to take.
Tools for Measuring and Tracking Conversion Optimization Metrics
-
Web Analytics Tools
Web Analytics Tools are software applications that collect, measure, and analyze website usage and user behavior data. They help you understand how visitors interact with your website, track website performance, and identify areas for improvement.
Web analytics tools can provide valuable insights into user behavior, such as traffic sources, which pages are most popular, how long visitors stay on the site, and what keywords they use to find the website. Some popular examples of web analytics tools include:
-
Google Analytics
Google Analytics is one of the most widely used web analytics tools available, offering robust data tracking and analysis capabilities for businesses of all sizes. It provides various metrics and reports, including information about website traffic, user behavior, conversion rates, and more.
-
Heap Analytics
Heap Analytics is a powerful web analytics tool that tracks user behavior and provides insights into user actions. With heap analytics, you can access advanced features, such as automatic event tracking, funnel visualization, and user segmentation, to help you understand your users and optimize your website for better performance.
Heap Analytics is a paid tool suitable for you if your website has high-traffic websites or complex user interactions.
-
Adobe Analytics
Adobe Analytics is a web analytics tool that provides a comprehensive view of website performance, user behavior, and customer journey insights.
It offers advanced data analysis capabilities, such as predictive analytics, data visualization, and machine learning, that enable businesses to make data-driven decisions and optimize their websites for better results.
Adobe Analytics is a paid tool best suited for large enterprises with complex analytics needs.
-
A/B testing tools
A/B testing tools are software solutions that allow you to create and run experiments on your website or app to compare two or more versions of a page or feature and see which performs better at achieving a particular goal.
With A/B testing tools, you can test different variations of your website’s layout, design, content, and functionality to determine which version leads to higher conversions, engagement rates, or other testing goals. Some popular examples of A/B testing tools include
-
FigPii
Figpii is a conversion rate optimization platform with tools and resources for website owners and marketers to optimize their website’s user experience and conversion rates. Figpii’s suite of products includes tools for heat mapping, session recordings, A/B testing, and polls & surveys.
FigPii offers a free plan with up to 75,000 monthly visitors and limited features. Its paid plans range from $99-$339.99 per month, and pricing scales based on the number of visitors.
-
VWO
VWO is a popular A/B testing tool that offers many features, including A/B testing, heatmaps, session recordings, and more. It offers a visual editor that allows you to create and modify variations of your website pages easily. VWO also offers advanced targeting options, which allow you to target specific user segments with your experiments.
VWO offers a 30-day free trial that includes all features. Its paid plans range from $357-$1438 per month, and pricing scales based on the number of visitors.
-
Google Optimize
Google Optimize is a free A/B testing tool that integrates seamlessly with Google Analytics. It offers a visual editor that allows you to create and modify variations of your website pages without any coding knowledge.
Google Optimize also offers advanced targeting options, which allow you to target specific user segments with your experiments.
Google Optimize is free to use. However, it’s important to note that Google will shut down this tool come 30th of September, 2023. There are a couple of alternative tools to consider if you want to migrate from Google Optimize.
Over To You
In conclusion, tracking conversion optimization metrics is essential for any business looking to improve user experience and website performance and increase revenue.
It’s also important to remember that no single metric can provide a complete picture of website performance, and it’s crucial to measure various metrics to get a comprehensive understanding of website performance. This is why secondary metrics exist to give you additional insights.
With the right metrics and tools, businesses can optimize their website to provide an optimal user experience and increase conversions.
